
Editor’s note: This is the second installment in Ten Behind Office 2010, a series that features the Microsoft employees behind some of the new and updated features in Office 2010 and SharePoint 2010.
REDMOND, Wash. — April 8, 2010 — Sam Radakovitz went from making change at a mall arcade to making changes to a software program that’s used by 500 million people.
To the soft-spoken Excel program manager, it’s still mind boggling even a decade later. “I don’t even know if I’ve fully grasped it yet, the number of people using Excel day in and day out,” Radakovitz says.
Radakovitz recently developed a new feature for Microsoft Office Excel 2010 called “sparklines,” which he describes as intense, simple, word-sized graphics. Sparklines let users take large sets of data and present them visually in small spaces, for instance showing 20 years of stock price data in one small graphic that will fit inline in a report, or even within a paragraph.
“It’s the big picture in one, single space,” Radakovitz says.
Sparklines as a concept were created by information design guru Edward Tufte, a Yale professor of political science, statistics and computer science who has authored several books and frequently gives seminars on how to improve the visual display of quantitative information.
Radakovitz says many Excel users had already embraced Tufte’s idea of using sparklines as highly informative but small and readable displays of information. But users were creating sparklines the hard way, making a line graph or line chart in Excel, and then trying to miniaturize the charts.
“We thought it would be great if we could do (sparklines) in Excel without people having to jump through a million hoops,” he says.
Radakovitz is a football-loving, World of Warcraft-playing software engineer, but the experience of designing sparklines has turned him into a bit of a renaissance man when it comes to the visual display of information – he even collects creative informational graphics.
The bulletin board in his office is covered with charts and graphs he has clipped out of magazines not only because they make him laugh – a “Celebrities with Swine Flu” chart, for instance – but also because they’re attractive, well-designed displays of information. It’s exactly the kind of visual information displays he hopes Excel users can create using sparklines, he says.
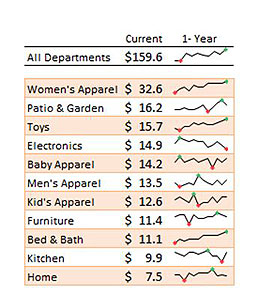
In the example above, the sales number alone captures a single moment in time, but adding sparklines gives history and shows a pattern of sales.
Microsoft News Center visited with Radakovitz to find out what it was like to go from working at the arcade to designing software features for millions of users, and about life at home with his fiancé Elizabeth, two dogs, two cats and three guinea pigs.
News Center: What do you think the arcade employee Sam would think of Excel program manager Sam?
Radakovitz: I went straight from the arcade to here – it’s pretty crazy. I didn’t envision being able to create software that would touch this many people. That said, I did lots of growing up at Microsoft. Back when I started I was a little cockier to some degree. I played loud music – “Intergalactic” by Beastie Boys on repeat. The guy 10 doors down came to my office door and said, “Hey, can you turn it down a bit? I’m trying to have a meeting.” That guy ended up being my boss and we have a great relationship. I was very young then.
News Center: How young?
Radakovitz: I was 20 years old, straight out of Renton Technical College, where I went to school for computer science. I joined the Microsoft Access group at first and five years ago went to Excel.
News Center: Did you feel like a hot shot, or was it a lot of pressure being so young and designing features that millions of people would use?
Radakovitz: There was pressure. Just that, “Hey, people are impacted by the work we’re doing” thing. It feels really good, though, to be able to go back to my mom and say, “Hey, I’ve been working for the last year on this feature and it’s going to be way better and people are going to love it.”
News Center: Why do you think people will love sparklines?

Sam Radakovitz developed a new feature for Excel 2010 called “sparklines,” which he describes as intense, simple, word-sized graphics.
Radakovitz: One of the areas we want to invest in is business intelligence, and part of that is making sense of your data. One of the ways to do that is visually – people are just visual by nature. Ever since you were a child you could recognize different colors before you could speak.
Sparklines are going to be great for taking that huge data set, bringing it down into a nice cell, and being able to stick that into any reports or dashboards that you have.
News Center: What will be your favorite part of seeing sparklines “in the wild” when Excel 2010 is released?
Radakovitz: People are creative. They’re going to do stuff that I haven’t even thought of yet. I’ll just love to see how they’re going to do that. We try to make the features flexible enough that you can do whatever you want – Excel’s always been that way.
News Center: What do you do when you’re not working?
Radakovitz: I recently bought a house so I’m learning all about how to fix up houses. I recently went to Home Depot and bought a bunch of wood and built a guinea pig fort. It’s the first thing I’ve ever built – I thought it turned out pretty well.
News Center: And you’re a gamer?
Radakovitz: There’s definitely some World of Warcraft and Xbox with friends. I enjoy playing those games that reach out to friends and other people.


