You’re fit, you regularly ride your bike long distances and in the back of your mind a small part of you wonders just what it is that separates you and the professional cyclists who ride across the mountains of Europe each year.
Well, if you had been in Western Australia competing in the Satalyst Tour of Margaret River early in November you could have found out.
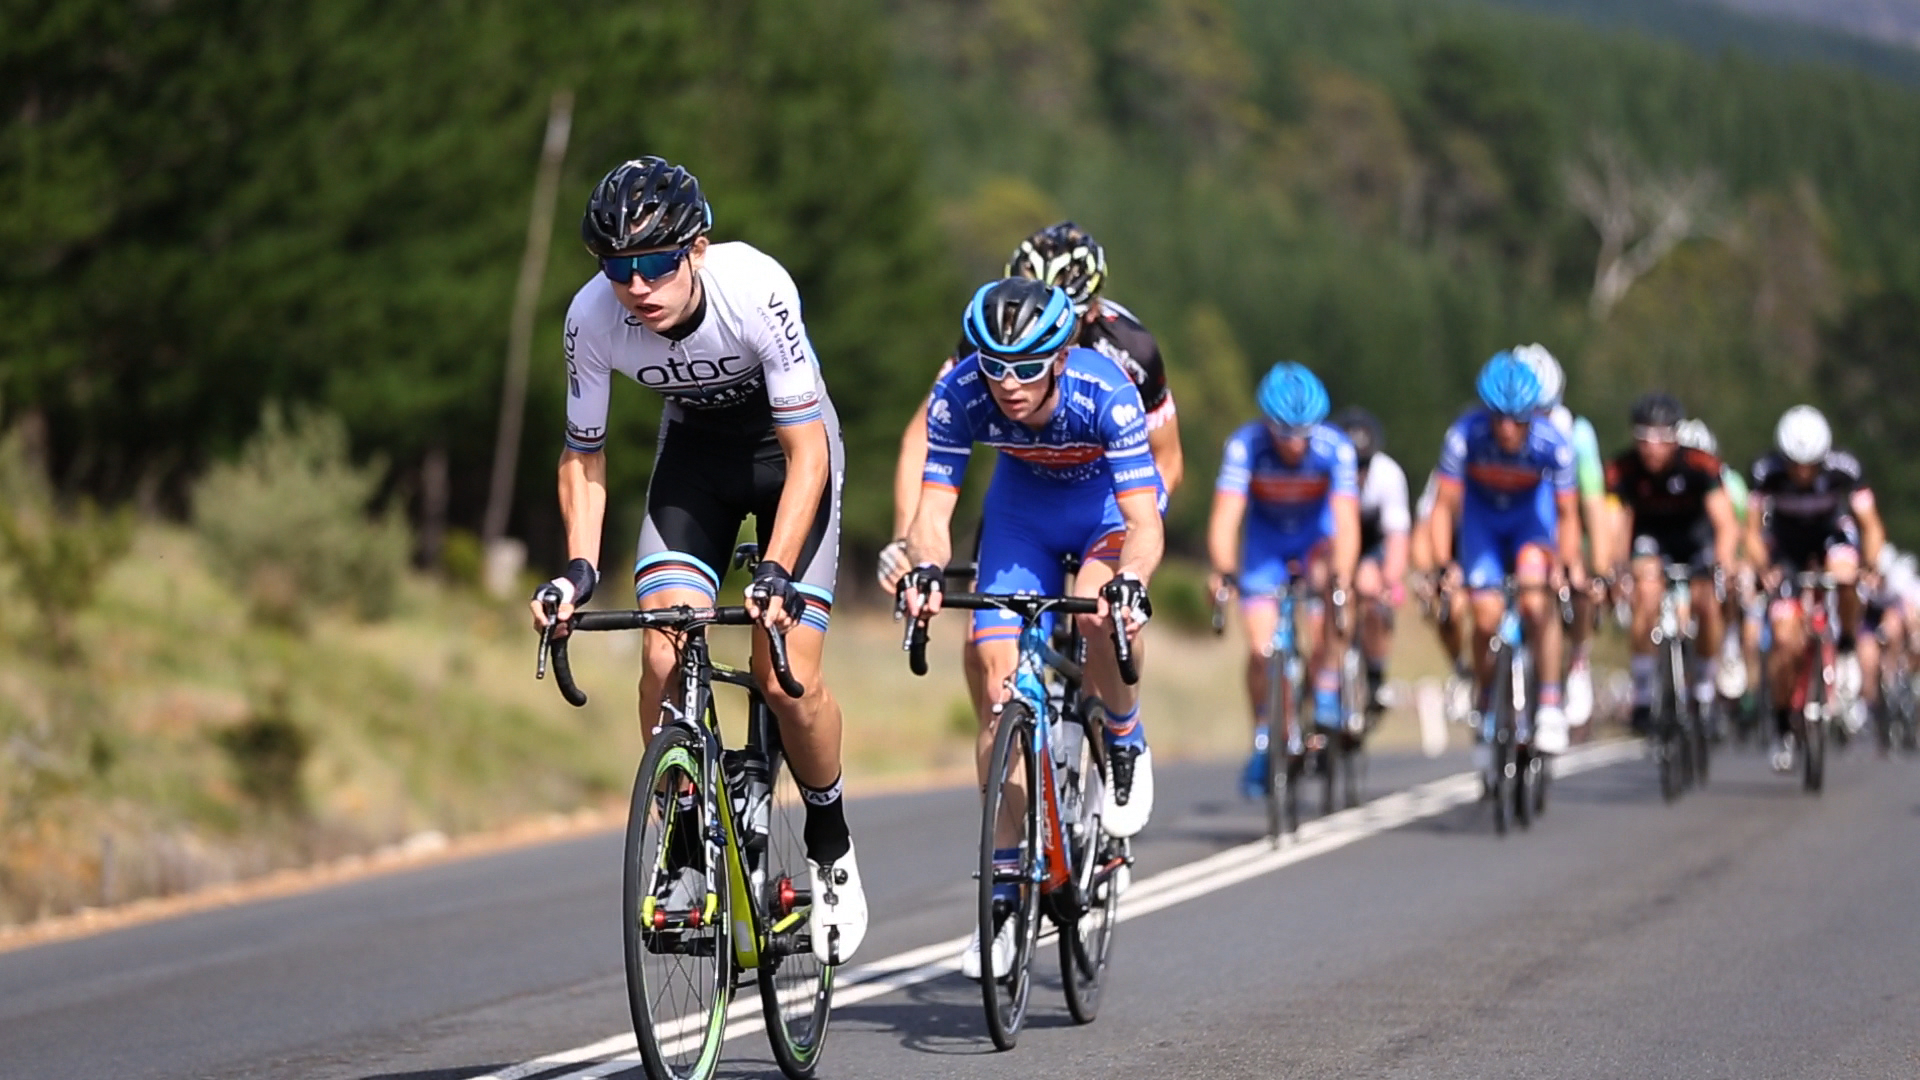
The four stage 230km tour is pro-am style racing, with professional teams and riders competing against teams from the corporate world and Sunday bike clubs.
This year, the seventh staging of the annual event, around 600 riders – including 20 all female teams – made it one of the largest competitive road cycling events in Australia. Satalyst, a major sponsor of the tour, had a surprise for spectators, competitors and announcers.
Satalyst is a Perth-based business specialising in Microsoft technologies and focused on delivering high quality project-based IT solutions.
The principals also have a passion for cycling, which came in handy when Cycling Eventures, the company behind the Tour of Margaret River, asked Satalyst for some data which might help spectators become more involved with the event.
The result was the Satalyst Tracker.
As Todd Elliott, the managing director of Satalyst, explained, because of the large distances involved in the race, the race commentators have enormous difficulty being able to relay information to spectators during and at the end of the race.
“We were talking to them and they said it’d be great if we could have a thing like they have in the Tour de France where you can see where the riders are at and how they’re going.
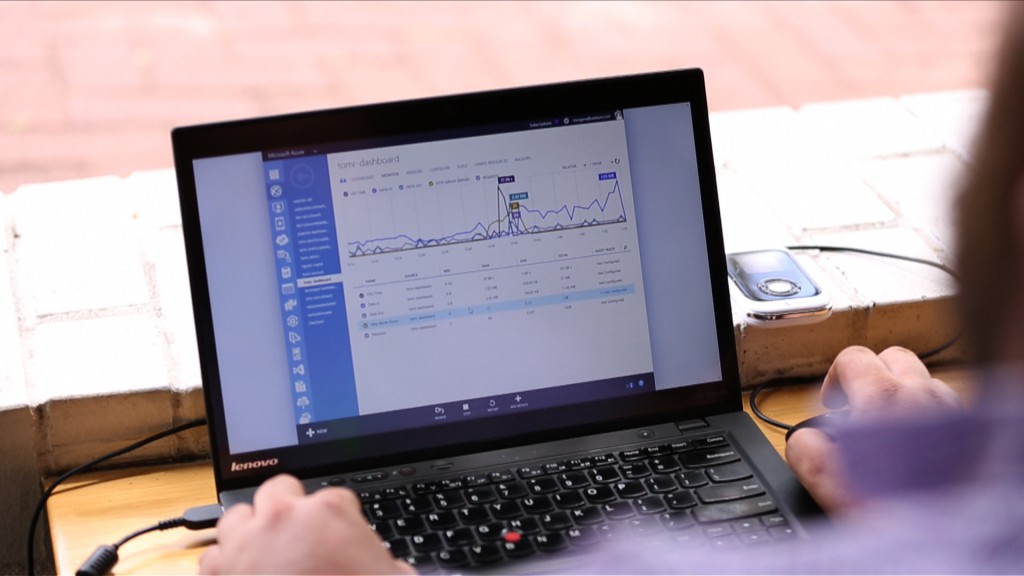
“And then we thought, well, showing where riders are on a map is great and it’s interesting, but we can do a whole lot more now with the Azure IoT Suite and we can actually get data from the bikes: so speed, location and – one that’s not as easily reported – power.”
That‘s where the ability for the Sunday rider to compare themselves with the pros comes in.
“During the race, spectators can follow how riders are performing on the course. They can see a rider’s speed and location and get an impression their effort, fitness and fatigue by looking at their power output and heart rate.
“So it really provides a full interactive experience for all those involved in the race. Not only the spectators, but also the competitors who can look after the race and see how they compared as a weekend punter to a pro rider going up this hill, or how long did it take them to do this section and what was their power output and things like that.
“What it really does is it takes the involvement of both the participants and the spectators to a much deeper level so they’re much more involved with the event.”
The development took five weeks, with the possibilities being unleashed by Azure IoT Suite making the development process much faster, cheaper and less complex than was possible previously.
The Satalyst Tracker consists of an Android phone that supports wireless technology to communicate with devices on the rider and on the bike. The information is then transported through the mobile network, back to Microsoft Azure.
The development took five weeks, with the possibilities being unleashed by Azure IoT Suite making the development process much faster, cheaper and less complex than was possible previously.
Aidan Morgan, Satalyst CTO said, “It’s a pure Azure solution. We can spin up the machines, deploy the software to the cloud using our Continuous Delivery pipeline and have the tracker up and running on Azure quickly and efficiently. All of that has meant that we’ve been able to do it in essentially five weeks.
“We used a lot of the Microsoft Azure technology stack to deliver the right solution, starting with IoT Event Hubs which ingest data from the devices, Apache Storm running on HDInsight providing real time processing power, Redis cache for short term storage / efficiency and Azure SQL databases for long term storage. The end result is presented using Azure Websites for the spectators to view on whatever device they have providing mobility and allowing spectators to be involved in the event experience.”
For commentator Gary Suckling from Cycling Eventures, the tracker is a winner, “As a commentator, it’s very useful getting the data that comes to us, because now we can tell everybody: ‘He’s doing 100 kilometres an hour downhill, he’s got a wattage of 600, and his heart rate is this. All that is something we’ve never seen before, it’s so direct.”
Competitor Julia Kalotas, from the Niche Living Women’s Team, echoed his enthusiasm, saying the tracker, “really helps us refine our training and our racing techniques, and also in conjunction with our teammates and our team managers and coaches, it allows us to be the best riders we can be, and hopefully have a few wins.”
From Satalyst’s point of view, the Tour of Margaret River was a trial that has shown the tracker has huge potential. Over the four-day event, around 930 people viewed the Satalyst Tracker. A majority of those originated from mobile devices in Australia, but the tracker site also got hits from the US, UK and Asia.
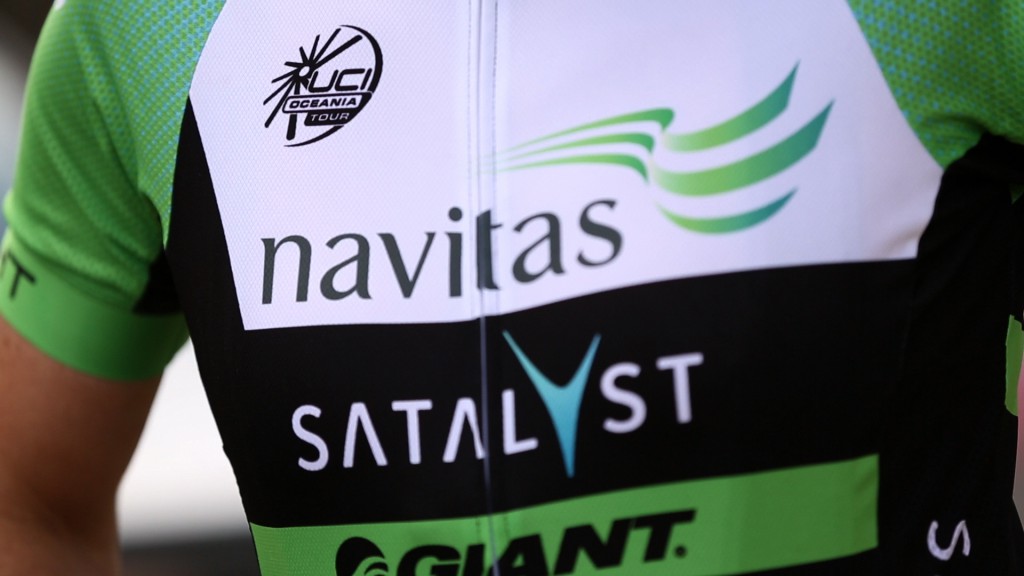
Some amazing race insights such as the Navitas Satalyst Racing Team being down by 1 minute and 15 seconds with 15kms to go in Stage 4, but managing to come through for a 5 second win, would not have been possible to share without the tracker. In the same race stage, spectators could see live data showing an incredible 1000 watt burst from Julia Kalotas as she powered through the sprint to the finish line. Someone watching the tracker in the US was getting this data the same time as someone viewing it in Western Australia.
For those spectators on location, watching riders on the tracker meant they could see a rider’s location and speed which gave them the opportunity to calculate the time needed to get to the next vantage point for photographs or race to the finish line to see their rider coming in.
The Satalyst Tracker likely to be used with UniSA at the Tour Down Under in January and at the 2016 World Cycling Championships being held in Perth. Satalyst is looking and open to opportunities to use the tracker for mass participation events around the world.
An opportunity with Azure Machine Learning comes from work Satalyst is doing with the manufacturer of cycling power meters, which measure the power output of the rider.
“We’re building an IT solution around analysing pedal stroke and torque to improve rider efficiency and effectiveness. That’s the next level, a very deep technical analysis of a rider’s pedal technique that can then be used for medical rehabilitation, or for peak performance optimisation,” Mr Elliott said.
“We’re building that with a partner, Verve Cycling who supplies the power cranks for the Australian Institutes of Sport, high performance programs, Continental, Pro Continental and Pro cycling teams and other International sporting institutes. They’re going to be the first ones to be using the solution. That’s a logical next step for this product.”
From Margaret River to the Olympics via Azure. It’s not such a journey with the Internet of Things.


