Australian Pharmaceutical Industries – Optimising Retail Store Operations
![]() Microsoft News Center
Microsoft News Center
In this blog post we learn about James Matson’s PowerApps journey and his perspective as a full stack professional developer embracing low-code development with the Power Platform. James Matson is an IT Retail Innovation Lead at Australian Pharmaceutical Industries (API), a publicly listed company that is about to celebrate its 110th birthday as one of Australia’s leading pharmaceutical distributors and fastest growing health and beauty retailers. With presence across Australia, the API network boasts more than 480 Priceline and Priceline Pharmacy stores and 970 Soul Pattinson, Pharmacist Advice Club and Premium members and over 50 Clearskincare clinics. API is best known for their network of Priceline and Priceline Pharmacy stores.
James built a solution for Business Leaders (Area Managers), to gain insights on the health of their retail stores, and in doing so was convinced that “PowerApps had a lot to offer even to the most experienced developers.” The Power Platform connector infrastructure made it possible for him to easily integrate with Azure functions, Azure Table Storage, Bing Maps and existing web APIs built on Amazon Web Services. This increased the Microsoft footprint in an organization where the app development stack otherwise largely consisted of non-Microsoft components and services.
The speed at which I could build out these on-screen components helped me realise the appeal of low-code platforms.
PowerApps has a lot to offer even to the most experienced developers among us. – James Matson, IT Retail Innovation
Lead, Australian Pharmaceutical Industries
Business Scenario
Priceline Pharmacy is a much-loved health and beauty brand in the Australian market with the retail store teams providing an exceptional customer experience. Each team aims to deliver the right range of products at the right time, be well presented, and provide a warm and knowledgeable customer service experience.
Each month, the Business Leaders visit each of our 480+ Priceline stores, and primarily use the solution that James developed to access and view several retail and customer service metrics during key promotional events. These include how the store is tracking in regard to sales and basket size, and key best sellers
Before Power Platform – Business process, challenges and opportunities
Before investing in the Power Platform, the process of providing Business Leaders and other key retail employees with the kind of information required to make informed decisions varied across different stores. Useful data could be gathered in one of the following ways:,
- By running reports physically within the store
- By utilising central reports provided by Business Intelligence platforms, with a time delay
- By manually gathering data from various systems and bringing it together manually and distributed via email.
Each Pharmacy Business Leader would run reports at the support office to gather key retail metrics, interpret and format that information for inclusion in their own analysis, and then visit the store to get locally generated reports. They would also perform a review of the store from a visual merchandise and staff engagement perspective and record those results in a separate system, from which they’d export the results to include in a final email report.
The result of this process was hours of gathering information, and hours of putting that data together into an email report for the business. Each report ended up having a different look and feel compared to reports from stores in other parts of the country. During periods of peak promotional activity, the only way to ascertain how particular stores were performing, was to wait at least one business day for BI reports to run overnight and produce data related to the promotional activity in each store. By the time this happened, the opportunity to make decisions that might positively affect the outcome of the promotion had already passed. The challenges with the existing process were numerous:
- Manually transposing data from one place to another increases the chance of mistakes
- With multiple systems providing data, the process of bringing these together was manual and time consuming
- The resulting assessments were often based on old data and lacked consistency
Power Platform Solution – Heart In Hand App
The genesis of this app was a conversation between James and the General Manager of Retail Operations. James asked her – “if you wanted to know three things what would they be?” Her response was: Sales, Average Basket Size and Transactions per hour.
Through experimentation with PowerApps and Microsoft Flow, the “Heart in Hand” app was born. From the outset, the requirements were simple but critical:
- Deliver an app that allows Business Leaders to access store information both in the office and on the road.
- Bring together information from multiple systems about the performance of a retail outlet into a single view.
- Provide a platform that is pleasing to look at and easy to navigate.
- Provide a solution which enables hourly reporting by store during key promotional events
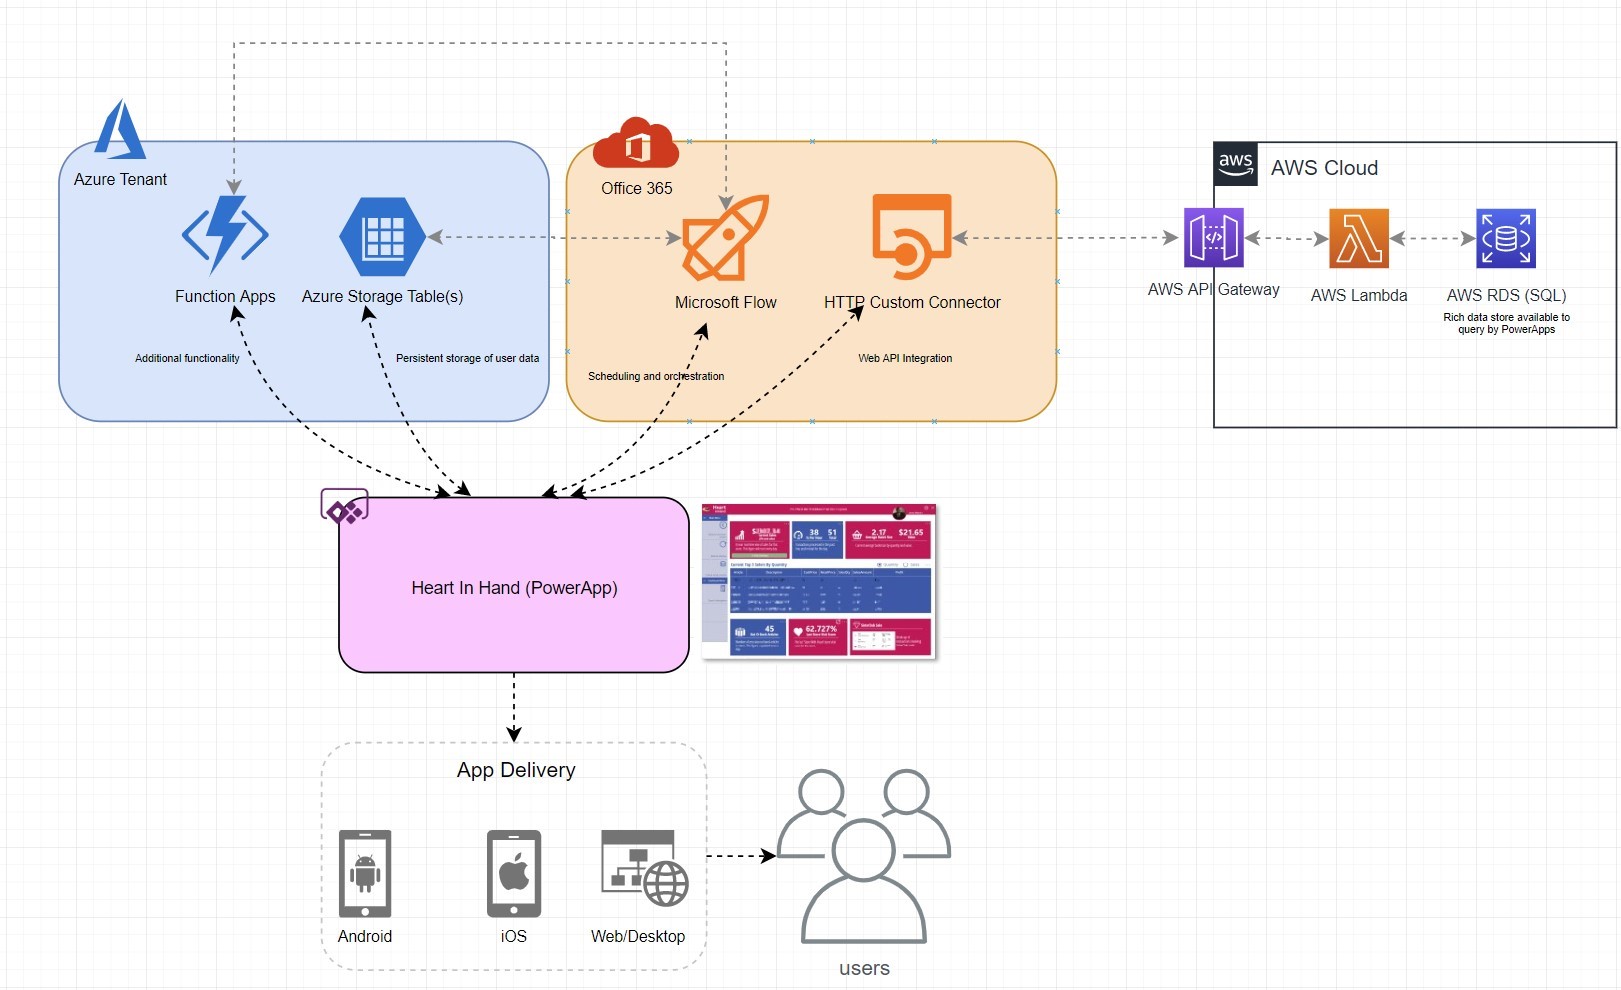
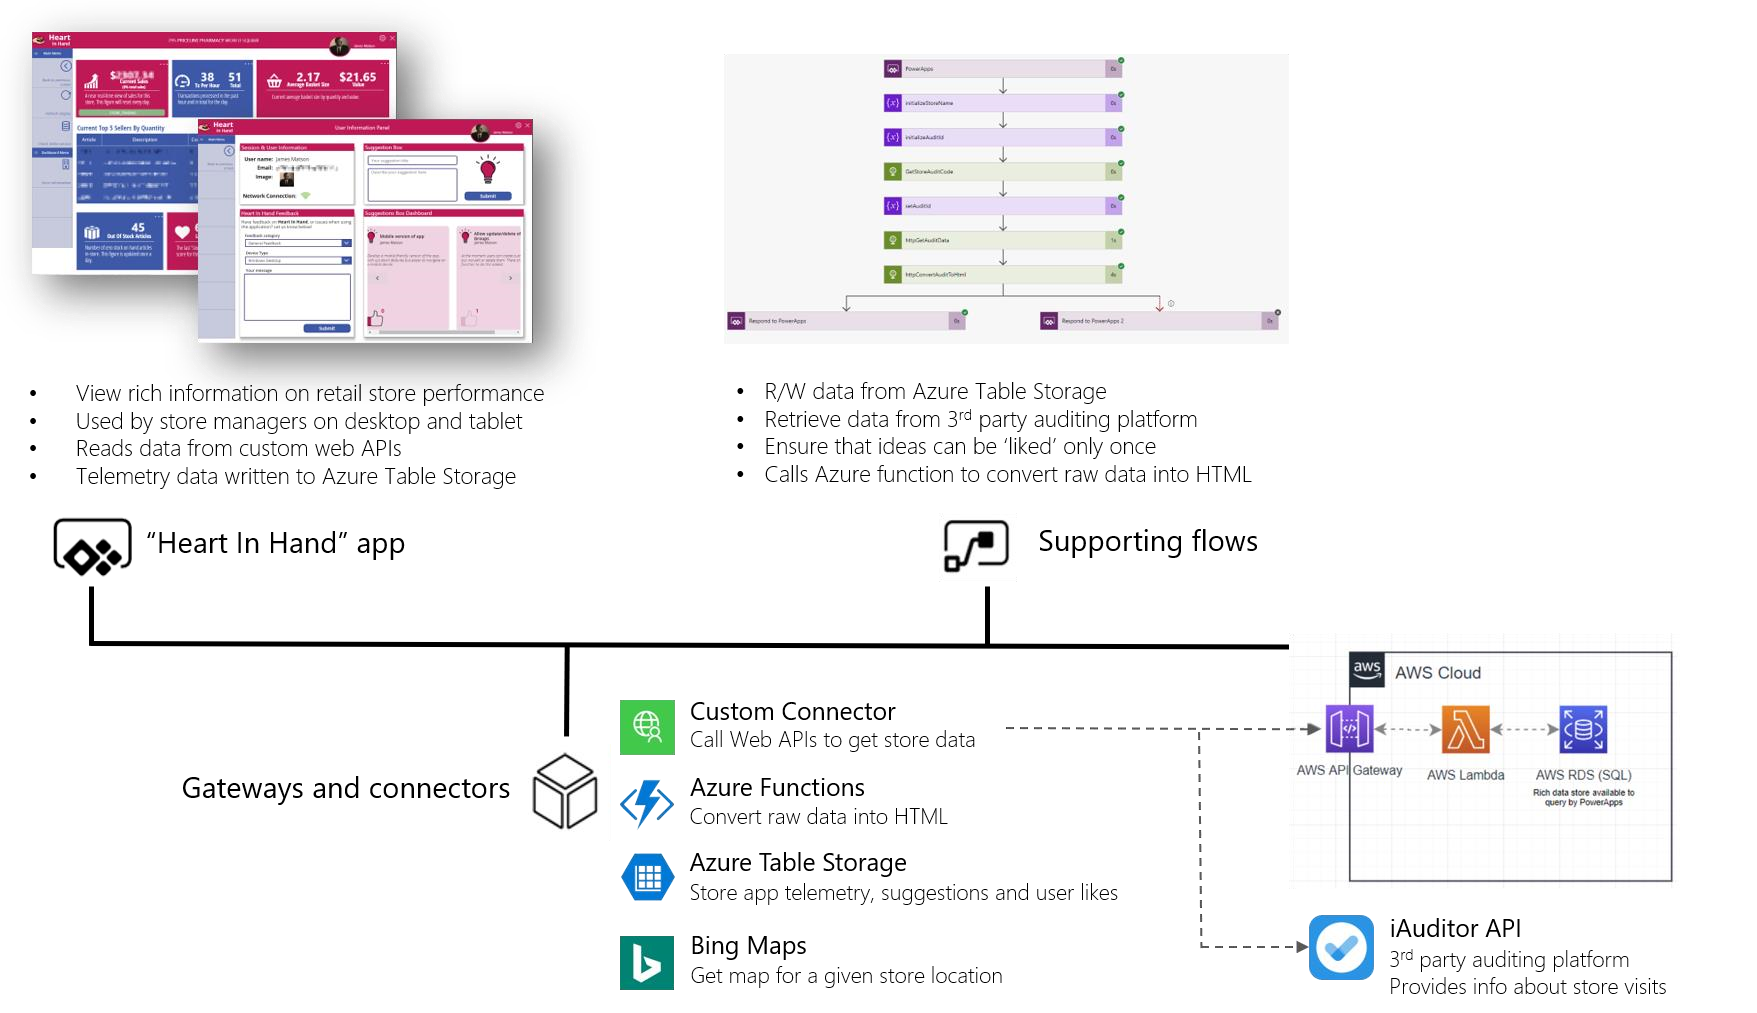
Below is a high-level diagram that describes how the “Heart In Hand” App operates
PowerApps
A PowerApps canvas app is used by Business Leaders during key promotional events to visualise how a store is performing in near realtime. The app can drive friendly competition between stores. , as business leaders check the performance of all the stores in their region.
Every new Business Leader has access to the canvas app, which can be used as a key tool for reviewing data during key promotional events.
The users can be on the road, at head office, or in the store and obtain an up-to-the minute view of how sales are tracking in their stores and their region.
The app users can use a form within the app to provide feedback on the app or post a new idea. Others can vote on ideas. Functionality is added to the app based on the ideas with the most votes/likes.
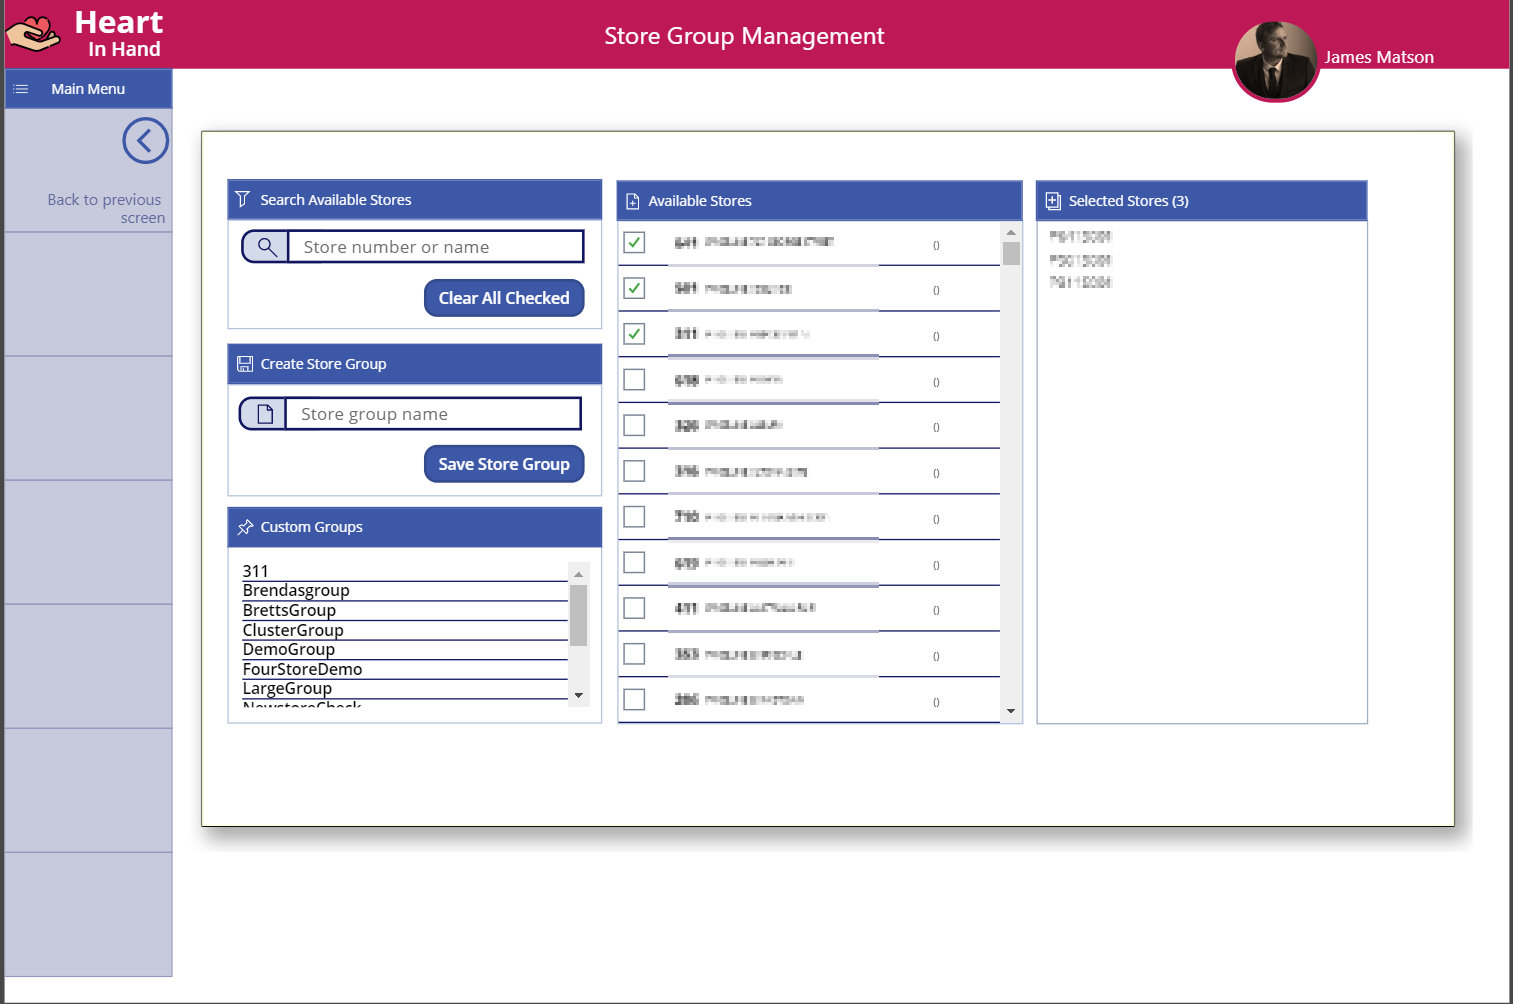
Users can also create their own custom groups of store locations to report on a subset of stores without seeing other information. The custom groups are stored in Azure Table Storage, each one consisting of an array of store locations, which are broken up into individual stores.
HTTP Custom Connector
The Custom Connector forms the basis of the data retrieval and display for the “Heart In Hand” app. The connector is backed onto a Web API which retrieves up-to-date sales data and other retail metrics which in turn have been sourced from each individual store.
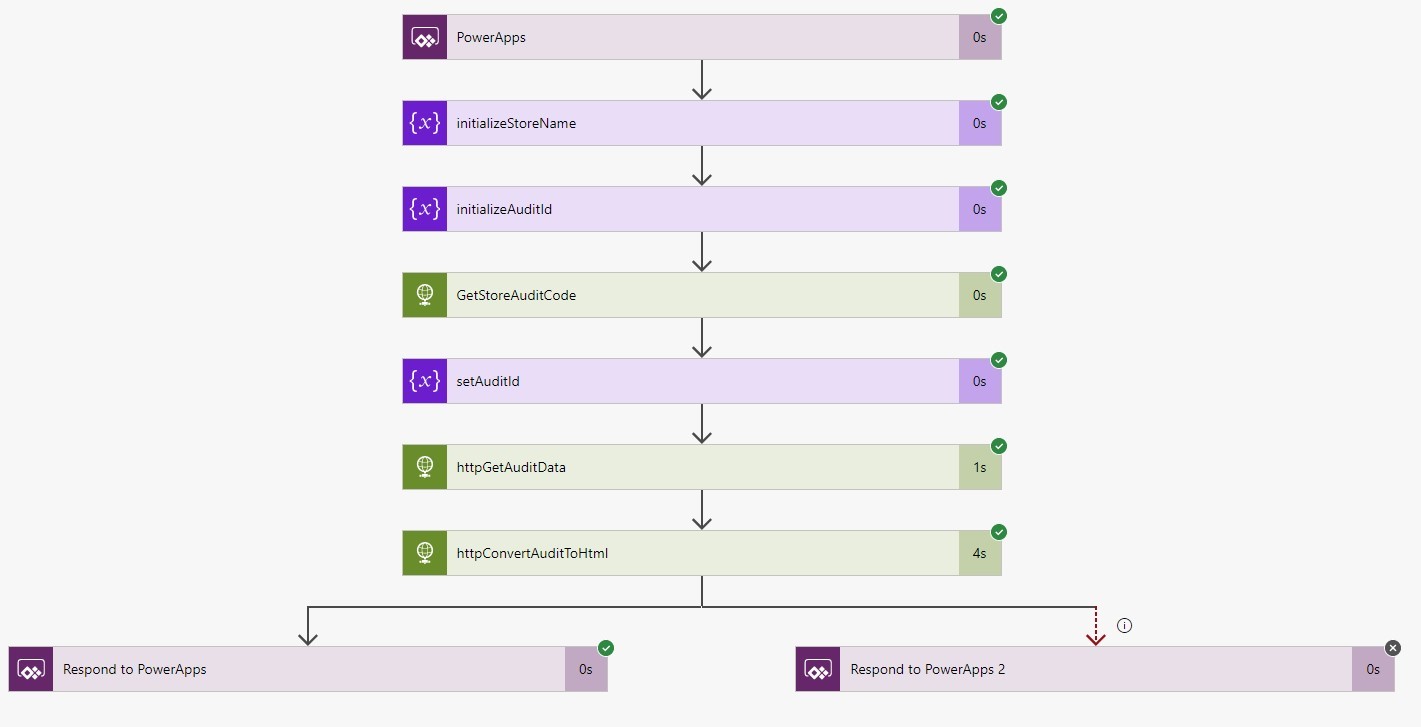
Microsoft Flow
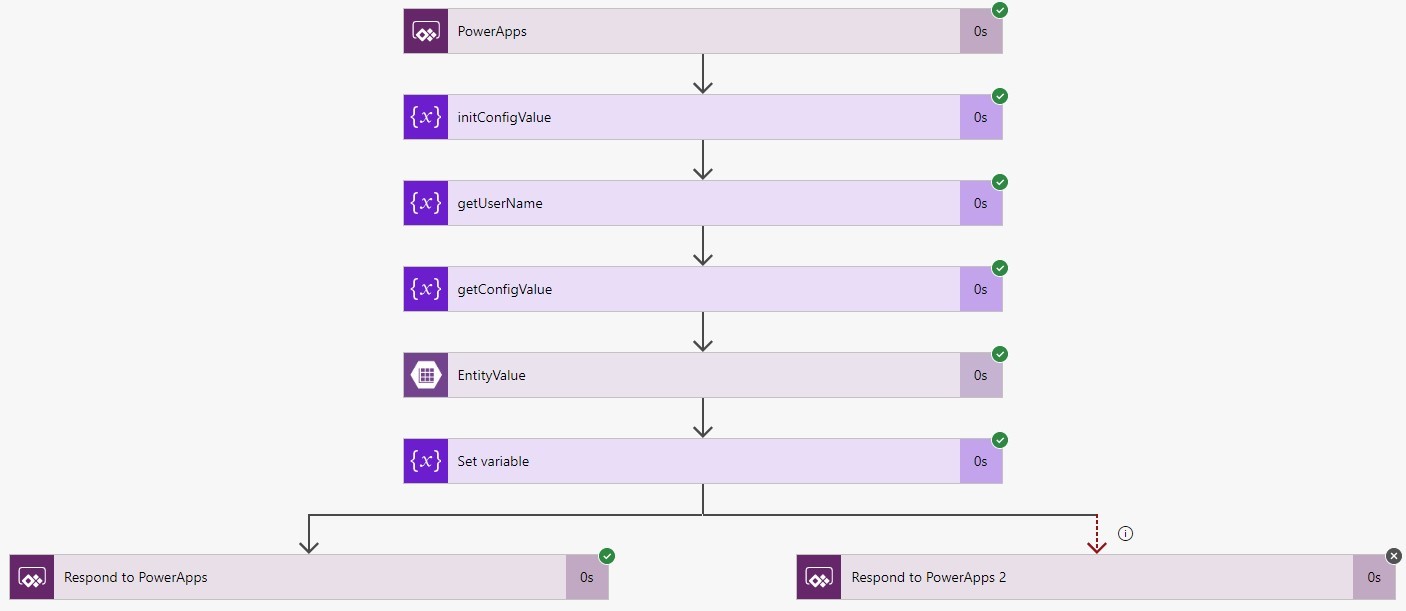
Microsoft Flow provides the app with the ability to execute more complex activities than PowerApps provides out of the box. The activities include things like storing and retrieving data from Azure Table Storage, and verifying the user’s access to different parts of the app. This data then populates a variety of fields within the app.
Another flow is used to obtain data from an external auditing platform – iAuditor – to display information about store visits into the app. The same flow uses Azure Functions to manipulate the raw data into HTML which can be displayed on one or more screens.
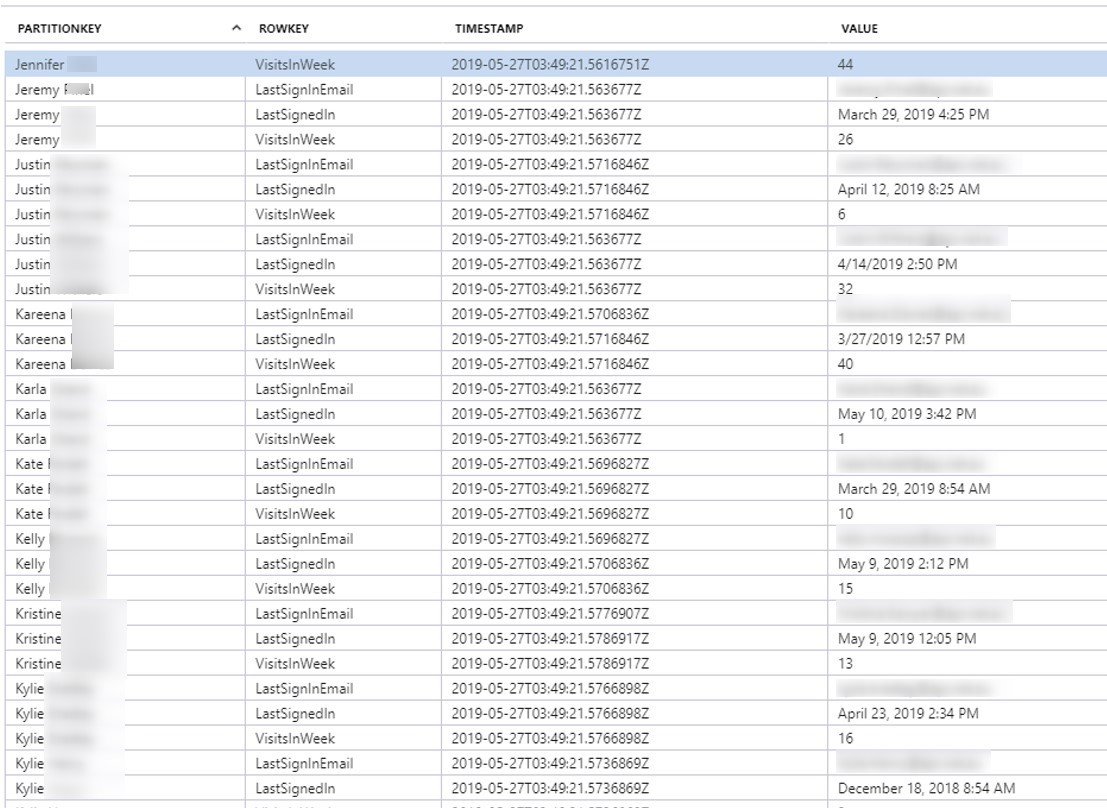
Azure Table Storage
Azure Table Storage is used to store useful telemetry information about app usage such as when the user signed in, what screens they visited and more.
A combination of Azure Table Storage, Microsoft Flow, and PowerApps is used for users to suggest new ideas for functionality in the app. They can submit their ideas via a PowerApps screen, and the data is stored in Azure Table Storage via Microsoft Flow. The Flow used can also track whether the user has ‘liked’ other peoples’ suggestions and ensure they can only like an idea once.
Ancillary services
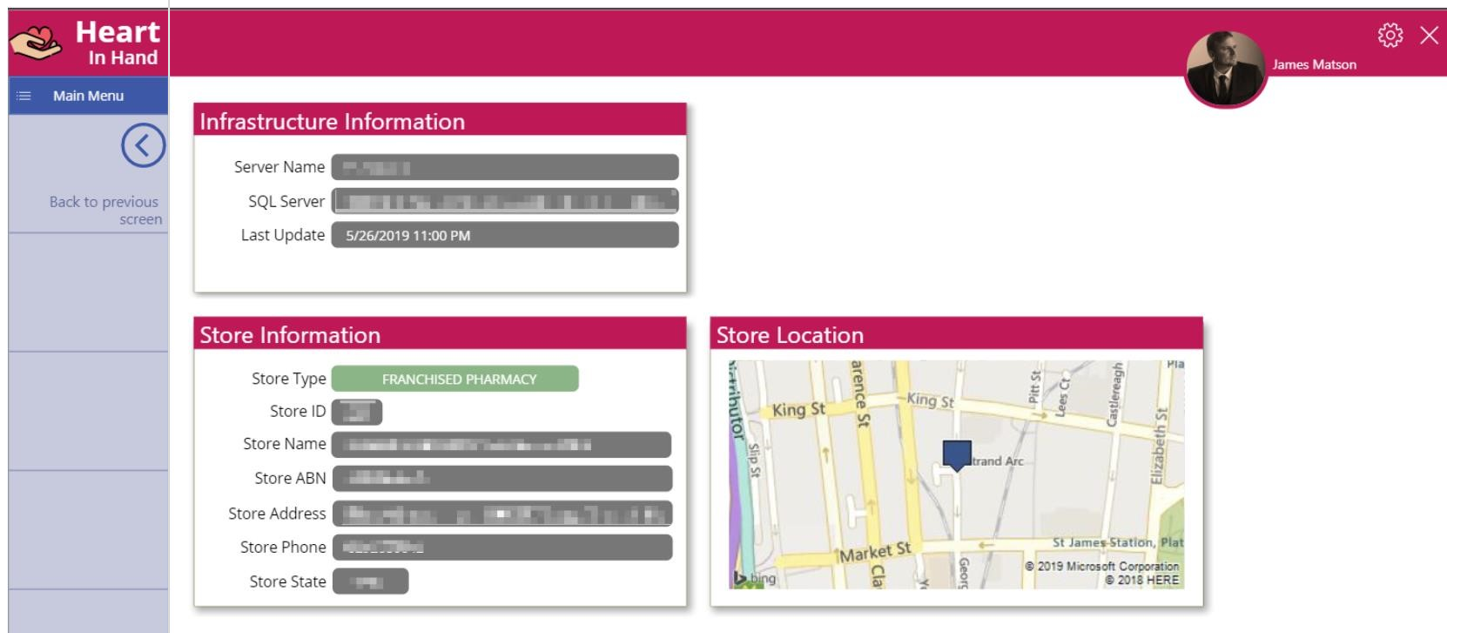
The Heart In Hand app also uses a number of different connections from the vast library of available connectors, including Bing Maps, which is used to show the geographical location of the retail store. The address obtained from the HTTP custom connector is passed into the Bing Maps connector to obtain the location of the store.
Solution Architecture
A PowerApps canvas app connected to web APIs via a custom connector is used to view insights on desktop and mobile devices. Several flows are used to write data to Azure Table Storage, manage user ‘likes’ on app suggestions, convert raw data into HTML, get location information from Bing Maps, and more.
Impact and Benefits
The Power Platform solution provides several benefits
- Near real-time data in the hands of key Retail Operations employees
- An easy to use user interface for navigating through critical retail KPIs
- Mobility on all common devices
- Provides an easy to ehance platform where users can shape the development of the app
- A marked increase in the ability of Business Leasers to understand the impact of promotional activities