Transport for NSW red flags dangerous intersections using data and AI
![]() Microsoft News Center
Microsoft News Center
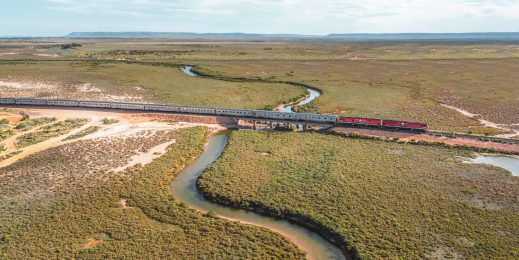
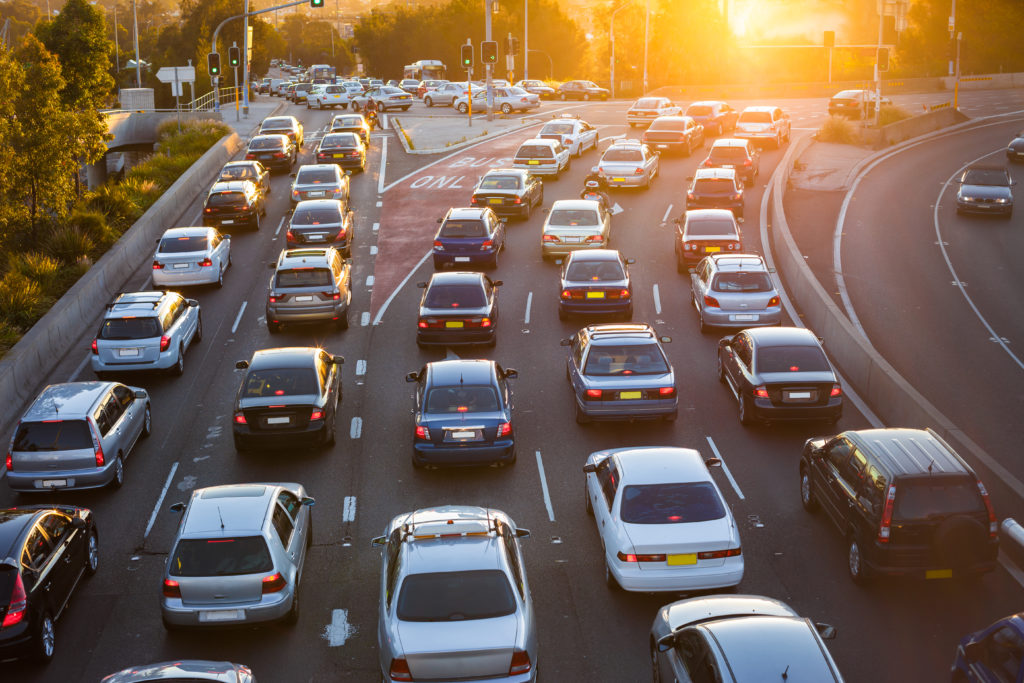
Wollongong’s Mount Ousley descent is not for faint-hearted drivers. That stretch of the Princes Highway in NSW is steep and winding; massive trucks, cars, caravans and motorbikes crowd its two south-bound lanes. Toward the bottom is a series of intersections with cars crossing the highway to head north or merging at speed from the left.
Julianna Bodzan was driving along the road when the idea for a proof of concept took hold.
What if there was some way to use data, AI and machine learning to identify potentially dangerous road intersections – allowing pre-emptive action to be taken? Mount Ousley’s intersections are known to be fraught – but what if other potentially risky intersections could be flagged early?
Bodzan leads the data discovery program in Transport for NSW’s Enterprise Data & Analytics Services. From a standing start in 2018, the team has grown and along with it the AI and machine learning capabilities of the organisation – all focussed on exploring how data can make NSW transport safer and more efficient.
This aligns with the Centre for Road Safety’s strategic plan which sets out priorities to help meet targets for reducing deaths and serious injuries on NSW roads. The Road Safety Plan 2021 is an important step towards NSW’s aspirational goal of zero road deaths and key to the State’s 40-year vision for transport.
Bodzan says that the capability and technology toolset now available at Transport for NSW means that it is now able to offer “sandboxes” to teams of researchers to explore how data and AI can be combined to address security and efficiency challenges. With the Microsoft stack offering solid technical foundations, teams have been able to access Transport for NSW’s own data, and bring in additional data sets, to tackle thorny issues.
After driving down Mount Ousley, Bodzan started to wonder if it might be possible to analyse telematics data and compare the patterns to those around dangerous intersections (known from crash data) to identify other intersections with similar patterns.
Motorists who regularly drove through the area were invited to participate, and the telematics information from their vehicles was collected and interpreted by Bodzan and her team during a two-week trial undertaken in 2019. Their goal was to find out whether there were other intersections in the area that were potentially risky.
During the Proof of Concept five intersections were identified as warranting further investigation. All five intersections have been added to the investigation process conducted by Transport for NSW to identify the highest risk locations on the road network to develop remedial solutions. Out of the five, two of the intersections have been scheduled for modification in the current financial year.
Microsoft caught up with Julianna Bodzan (JB) and Oliver Storey (OS) a business intelligence specialist on her team to learn more about the Dangerous Intersections Proof of Concept.
Microsoft: Tell us about this project.
JB: We looked at intersections known as dangerous intersections. Dangerous meaning, some kind of fatal or serious crash, , or other incident which happened so that we can clearly say that is a dangerous intersection. Then we start to examine how masses of people are behaving around those intersections.
If there are exactly the same patterns at another intersection where nothing has happened yet, we can say that it might happen here as well because people are acting erratically. What I mean by erratic behaving is, harsh braking, or harsh acceleration, or lateral movement just before the intersection, what speed they are going through.
We had a circle of interest around the intersection … when the vehicle is actually approaching the intersection how does it behave at 50 meters, how does it behave at 25 meters, and how does it behave going through the intersection?
MS: How do you track that?
OS: It was 25 records a second from 50 vehicles in the study, which were fitted with telematics devices for 10 months. They were initially centred around people who often travel in the city of Wollongong and people who often travel around schools and that sort of area, but that quickly expanded to other people who would drive around the Wollongong CBD area. So, it was clustered around densely populated areas and intersections that would have large amounts of congestion.
MS: How did you build the system to do this?
JB: We are on the Microsoft Stack and that’s what we used for this project. We used Databricks and Azure services to ingest the data and take everything into the cloud. Microsoft helped us to implement this.
OS: This is big data – we are talking over a billion rows of data in the end, across multiple different devices installed within the actual vehicles, that didn’t necessarily operate well with each other. The major challenge was data engineering.
MS: Getting the data curated and accessible must have been critical?
OS: If you give a Machine Learning algorithm terrible data, you’re going to get terrible results. So, I’d say, 70 per cent of our time was actually spent engineering our data, getting it into a position where we had that one single trip through an intersection which had all of our metrics for the actual vehicle, and then running a Machine Learning problem on that didn’t take long at all.
MS: What was the upshot of this?
JB: We did come up with a few intersections to reveal to the Centre for Road Safety. They asked for the top five.
OS: The ones that have never been classified before.
JB: So, we come up with the first five and they went out – they actually sent out some road engineers to check the areas out and those intersections have not been classified before. Now, what does it mean ‘it hasn’t been classified?’ They haven’t been flagged for incidents or massive crashes or fatalities happening at those intersections.
MS: And I gather in four of the five intersections the engineers found something amiss – a light wasn’t working properly or there were problems with the road markings?
JB: They actually came back with the validation of “Yeah, you might be right on that.” Obviously we can’t say it’s going to happen – but that’s the whole point of this study is to looking at which could be dangerous, preventing something happening.
MS: Can you envisage this sort of analysis becoming more widespread?
JB: We do have a lot of vehicle data – however, we don’t currently have ethical rules and regulations about how we can actually use those types of data, New South Wales Government is publishing an AI strategy and on the back of that we working on an AI strategy for Transport as well.
MS: Are there other opportunities to use data, AI and machine learning in Transport?
JB: Transport is not just roads. We look at railway lines, are thinking about pedestrians and school zones – and we are thinking about how we can use this type of data and enrich with other types of data to basically improve the safety of the network.
OS: I think computer vision as a field within AI and machine learning is interesting for a number of areas in Transport.
You can look at vehicle near misses for instance would be a great one. Where pedestrians are nearly hit by vehicles and maybe hot areas around the city where people are nearly hit by vehicles could be an indication that the pedestrian and walkways need to be designed better to make it safer, or that fences needs to be installed in particular places.
JB: Safety is a very, very important part – one of the most important parts – but we are also providing that continuous service within the transport system. We want our transport services and connections to satisfy our customers’ needs. What we are doing is really providing advanced capabilities which can be applied to solve a variety of different complex scenarios. The work we are doing is encouraging collaboration across the organisation as we tackle issues that are relevant across multiple areas.