New Delhi is one of the world’s most polluted cities and when its smog levels rise it’s always a big story.
Newspapers are filled with quotes and details from worried health experts and concerned environmentalists. Newscasters on TV read out official air quality figures from different parts of the Indian capital with an urgency normally reserved for incoming cricket scores.
With media attention squarely focused on the city’s air quality, few in the sprawling metropolis are unaware of the seriousness of its pollution problem. It’s no wonder that a growing number of its 20 million citizens and policymakers are demanding action.
But there’s relatively little outrage or worry away from the capital. Lots of other communities across India are also blanketed in choking smog, but their plight often goes unreported in the media, and public awareness is low.
Much of this is down to how data is gathered. The government currently operates an expensive network of Air Quality Monitoring Stations in 122 cities that monitor concentration levels of 12 different pollutants that are known to affect the health of people. But the air quality readings and analyses they generate can be hard to access–and even harder for many to understand.
Now a startup has developed a dashboard solution that makes real-time pollution data simple and accessible to everyone. The dashboard shows PM2.5 levels in the air of all 122 cities monitored by the government. PM2.5 are tiny, invisible particles 30 times smaller than the diameter of a single strand of hair and pose the greatest health risk to humans. The hope is that if more people understand the problem, calls for clearer skies will grow across the whole country.
Let’s look at Moradabad about 190 kilometers east of New Delhi. At the time of writing this article, it was officially ranked as having the worst smog in the country. A government monitoring station there showed that its residents were inhaling air with a dangerously high PM2.5 levels of 190 compared with New Delhi’s relatively better PM 2.5 levels of 115.
Yet few living there would have known that. Instead of reporting that day’s pollution levels, the local paper devoted its headlines to the rising price of brass and a resumption of regional train services.
“Of course, pollution is a problem,” says Rajnath Singh Chauhan, a long-time resident of Moradabad. “There’s no way of us knowing just how bad the air quality is. But I don’t think it’s as bad as New Delhi.”
This sort of misconception is all too common among millions of people.
Last year, two-thirds of the world’s most polluted cities were in India. According to a recent scientific report, 1.7 million deaths in the country in 2019 alone could be attributed to air pollution. On the economic front, air pollution resulted in a loss of USD 36.8 billion or 1.4% of India’s GDP that year.
During the most polluted days, PM2.5 readings routinely cross the 999 mark, which is the threshold of most air quality sensors–they can’t read beyond it. According to the U.S. standards, PM2.5 above 100 is unhealthy for sensitive groups and anything over 150 is unhealthy for everyone.
Even on what appear to be clear blue days to the naked eye, the air can be unhealthy to breathe.
In relatively well-informed New Delhi, most offices and many households that can afford air purifiers have them humming away constantly indoors.
But without accessible, understandable, accurate and up-to-date information, complacency can set in, according to Ronak Sutaria who has founded Respirer Living Sciences–a climate-tech startup that is using data to push for a clean-up.
“For most part, air quality in India is monitored through government projects. About 40 of 240 Continuous Air Quality Monitoring Stations set up by the government are in and around Delhi alone, which is why it’s no surprise that it always comes on top (in conversations) when it comes to air pollution,” he says.
Even in places where data exists, like Moradabad, it’s stored in databases that not many track regularly or are not accessible to citizens at all, he says.
Sutaria is on a mission to increase awareness about air quality right around the country–not just in New Delhi and 121 other cities and towns that are monitored by the government. He hopes that greater awareness about air quality will spur more actions from citizens and policy makers to tackle the menace.
Helping him in his quest is a strong collaboration with Microsoft Research (MSR) India’s SCAI program.
“Through SCAI, we’re partnering with NGOs, startups, and academic groups on problems that plague the communities they work with. We help address some of these through our deep research assets, grants, and collaboration,” says Satish Sangameswaran, principal research program manager at MSR India.
Respirer Living Sciences is one of the four organizations in SCAI’s first cohort. Using access to machine learning and data visualization specialists, as well as Azure and Power BI credits from other Microsoft entities, Sutaria built a Power BI dashboard to tap data from 240 government air quality monitors as part of the National Clean Air Program tracker.
“The tracker pulls data from all the monitoring stations into our Azure SQL backend and visualizes it in real time. The information is updated every day so you can see the air quality across 122 cities,” Sutaria says.
“You can also see historical trends and levels of different pollutants across individual cities over a period of a given year or pollution levels at different times of the day.”
These Power BI dashboards enable anyone to select different filters to get insights that are meaningful to them. One doesn’t need any data science knowledge.
Having a dedicated Power BI dashboard also helps government officials track whether their expensive monitoring stations, which can cost up to USD 200,000 apiece, are working or not.
If any station is offline, they can now send someone over to fix it. Without this dashboard, no one would realize if a monitoring station in a small town went offline unless someone asked for data from that specific station.
Sutaria also plans to create dashboards to show how taxpayer money is being spent on tackling air pollution and the impact. This will give them faster insights on the policies and projects that are working.
Prior to Power BI, Sutaria had tried other data visualization tools but they began to lag as the volume of data kept increasing. This wasn’t the case with Power BI dashboards as he was able to run the data through Azure’s SQL servers, making the process fast and seamless.
More importantly, it enables him to execute all of this with a shorter turnaround time without him having to invest in a large development team.
“Typically, it would have taken us four to six months and team of developers to pull out all the analytics and visualize that amount of data at these depths,” he says. “But when you’re using Power BI, you can do all of this with just one analytics resource with a few years under their belt; they don’t even need to be programmers! We were able to execute this project in just a little under four weeks with just one analytics engineer.”

The tracker dashboard project has been a big milestone for Sutaria. His long-term vision, however, is to create a network of low-cost air quality monitoring sensors to provide a far wider scientific view of the air the country breathes.
“I’m fairly certain there are other cities where the air quality index is worse,” he says. “But there’s no way to find out because these places are not being monitored. We estimate that for a fair analysis of air quality index in India, we need to be able to gather data across 4,000 to 8,000 locations across the country.”
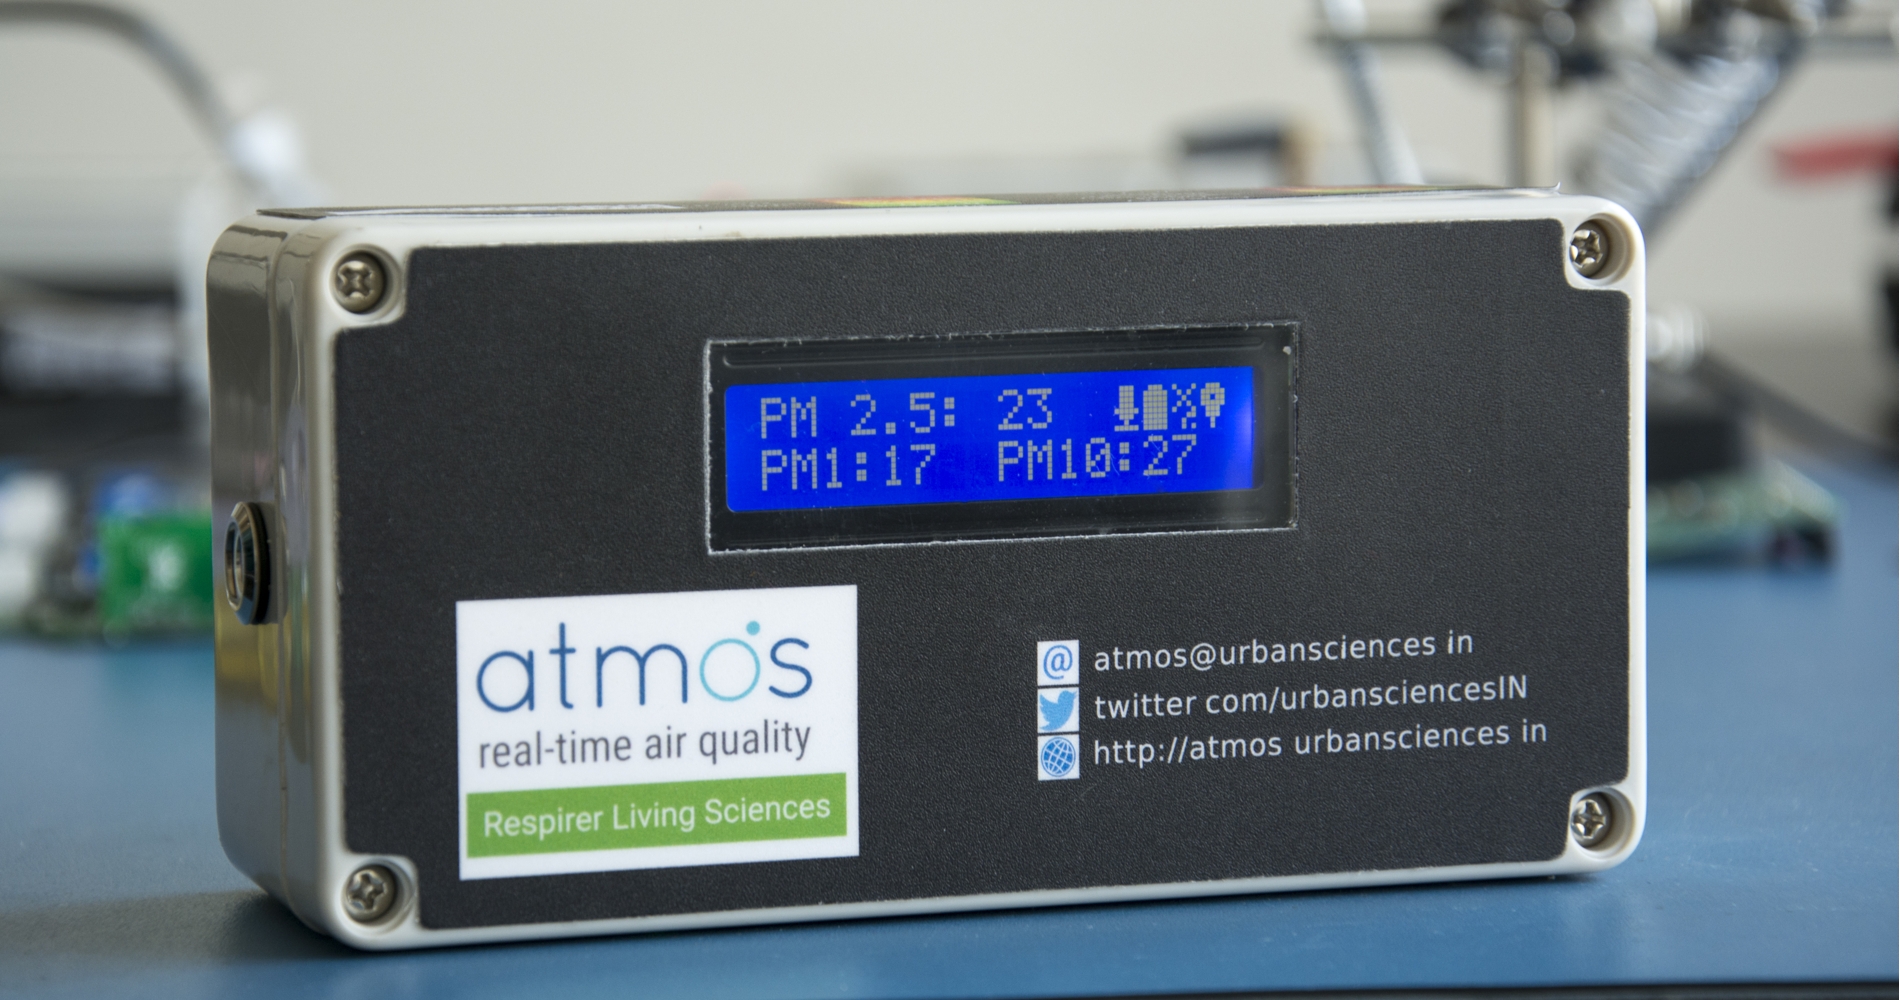
Sutaria’s plan is to fill the gap with affordable air quality monitoring devices like Atmos that his startup builds. It costs up to USD 4,000 to make, which is significantly lesser than the USD 200,000 needed to set up one government monitoring station that can track all the 12 pollutants.
MSR India’s Sangameswaran says the groundwork for this ramp-up is being prepared.
“When thousands of devices come into play, it is important for a small startup to efficiently manage the network,” he says. “What happens when a device shows abnormal data? Is it a sensor malfunction or there’s a spike in data? Unlike the present scenario, it won’t be possible to send an engineer to figure out the problem.”

Researchers at MSR India Labs have come up with a technique called dependable IoT that monitors the health of IoT-based devices using a fingerprint of their battery’s performance.
About 1,000 Atmos devices have been used by housing societies, schools, industrial companies, and even government organizations for monitoring air quality in their locations but currently there is no platform for them to share the data captured from the devices.
In the future, Atmos users will have an option to make the data they gather publicly available. These devices, like the government’s monitoring stations, will also be displayed on a Power BI dashboard and be accessible to everyone.
By doing so, Sutaria will be able to deliver hyper-local air quality data so citizens know what they are breathing at a neighborhood level and not at a city level.
“Air quality is not a static thing,” Sutaria says. “It changes drastically–sometimes by 100 to 200% within the hour. Having this data will help people decide at what time of the day they may want to step out. Or in the case of schools, at what time they can schedule outdoor activities for the children.”
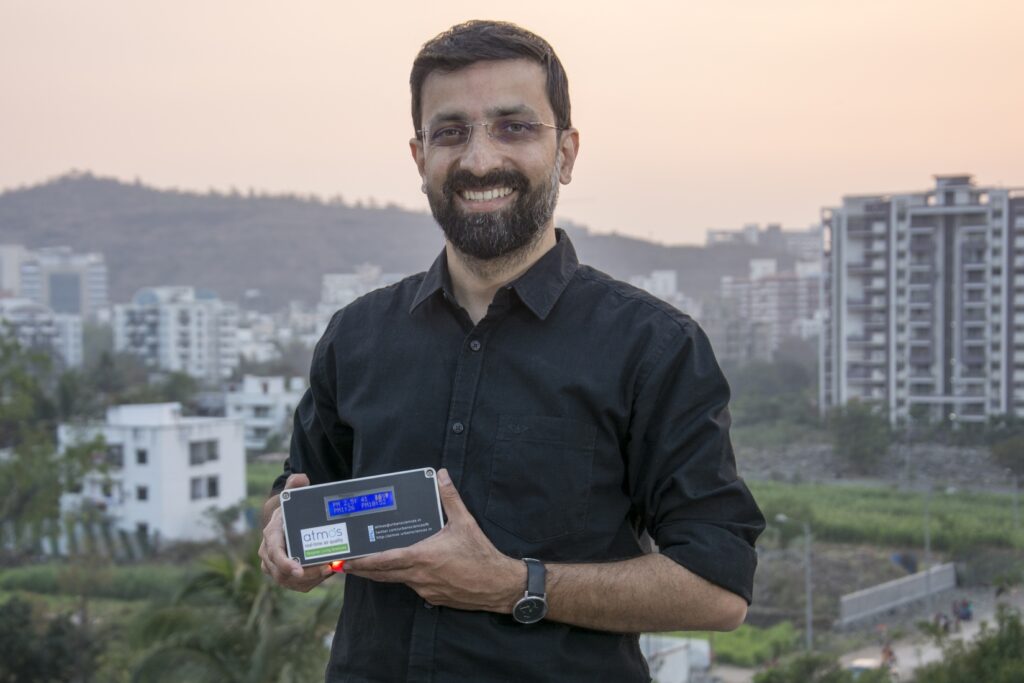
Top image: Ronak Sutaria, founder, Respirer Living Sciences (Photo: Omkar Dhas for Microsoft)
Abhishek Mande Bhot is an independent writer and editor covering news, lifestyle, and luxury for publications in India and the US.


