Meet Carnegie Mellon’s energy sleuths
![]() Lorence Heikell
Writer
Lorence Heikell
Writer

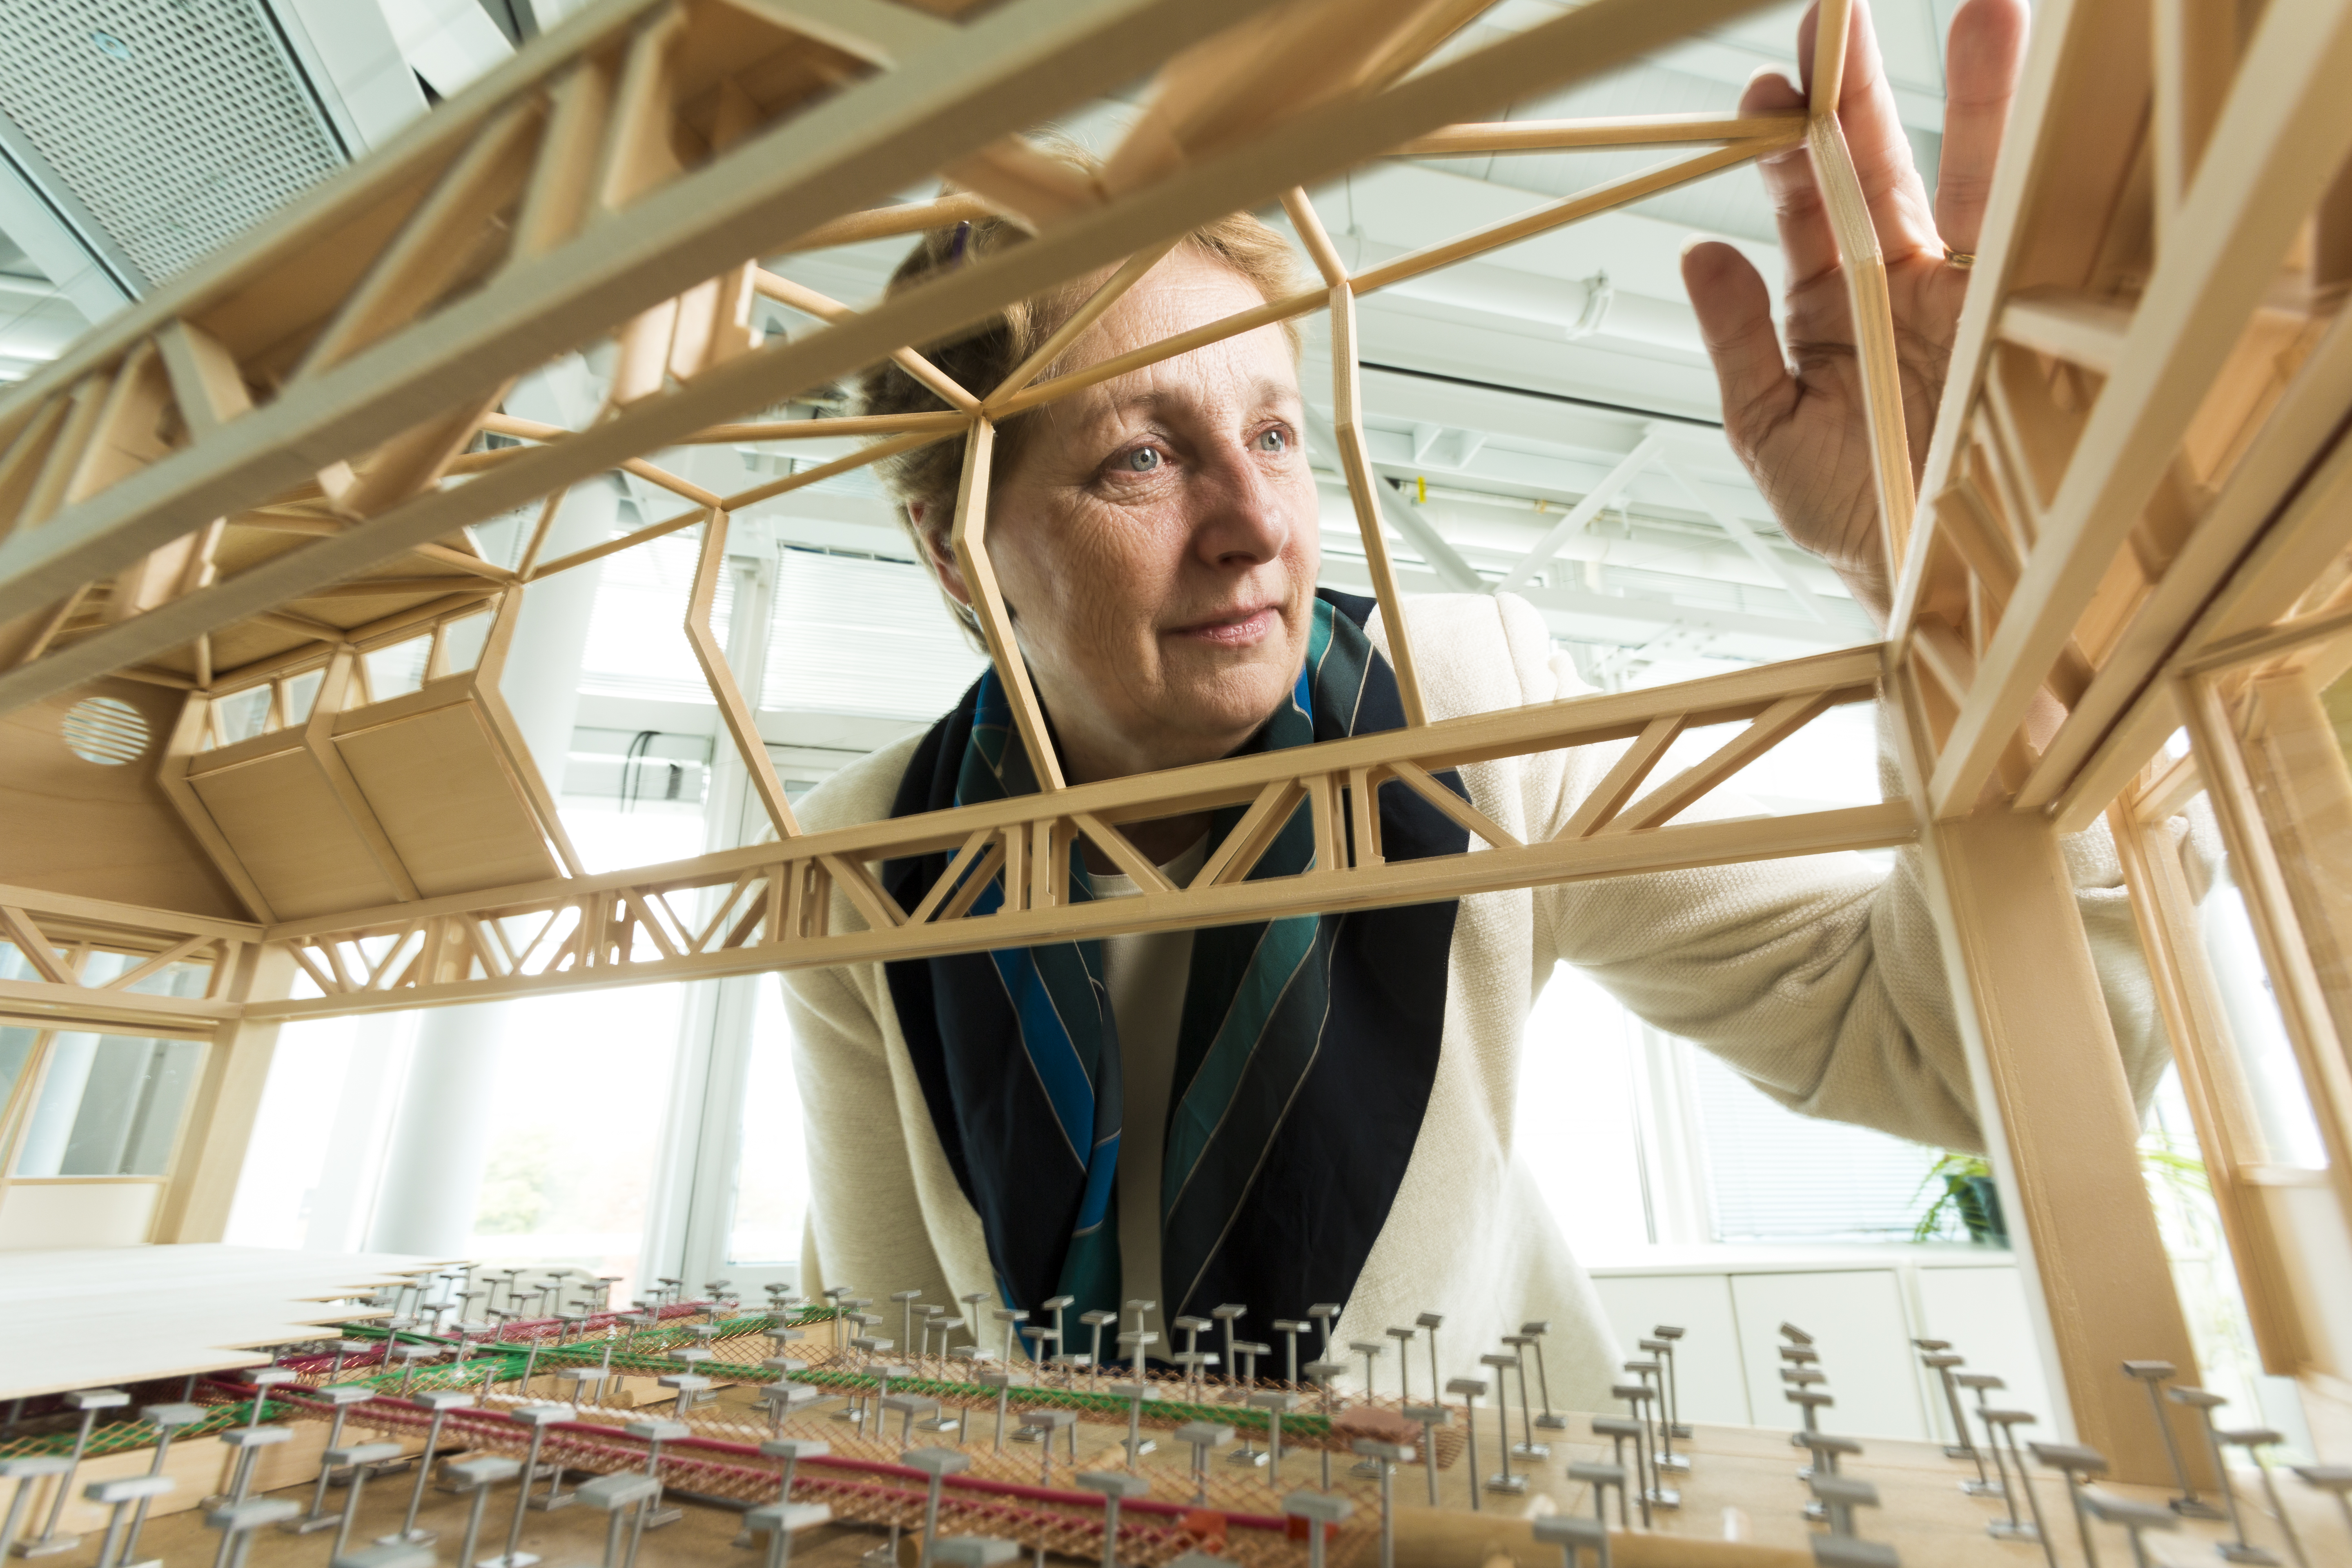
Vivian Loftness is obsessed with sustainability and building performance. Having called many different cities around the world home — from her birth city of Stockholm, to early years in Los Angeles and Paris, to study and work stints in Boston, Helsinki, New York City, Cologne, Athens, Ottawa and finally, Pittsburgh, where she is a professor at Carnegie Mellon’s School of Architecture — Loftness has checked out more than a few buildings close up.
Loftness’ singular passion is for sustainable architectural design and the need to get buildings in our world to a “zero state” where they have the smallest possible energy footprint without sacrificing comfort. This is no small feat, and a problem that is technological as much as it is architectural. But advances in technologies such as cloud computing, data analytics and services such as Microsoft’s Azure Machine Learning are helping Loftness and two researchers at Carnegie Mellon’s Center for Building Performance and Diagnostics slowly crack the code, one building at a time, and in ways previously unthinkable.
The ‘Intelligent Workplace’ — Where the Data Journey Begins
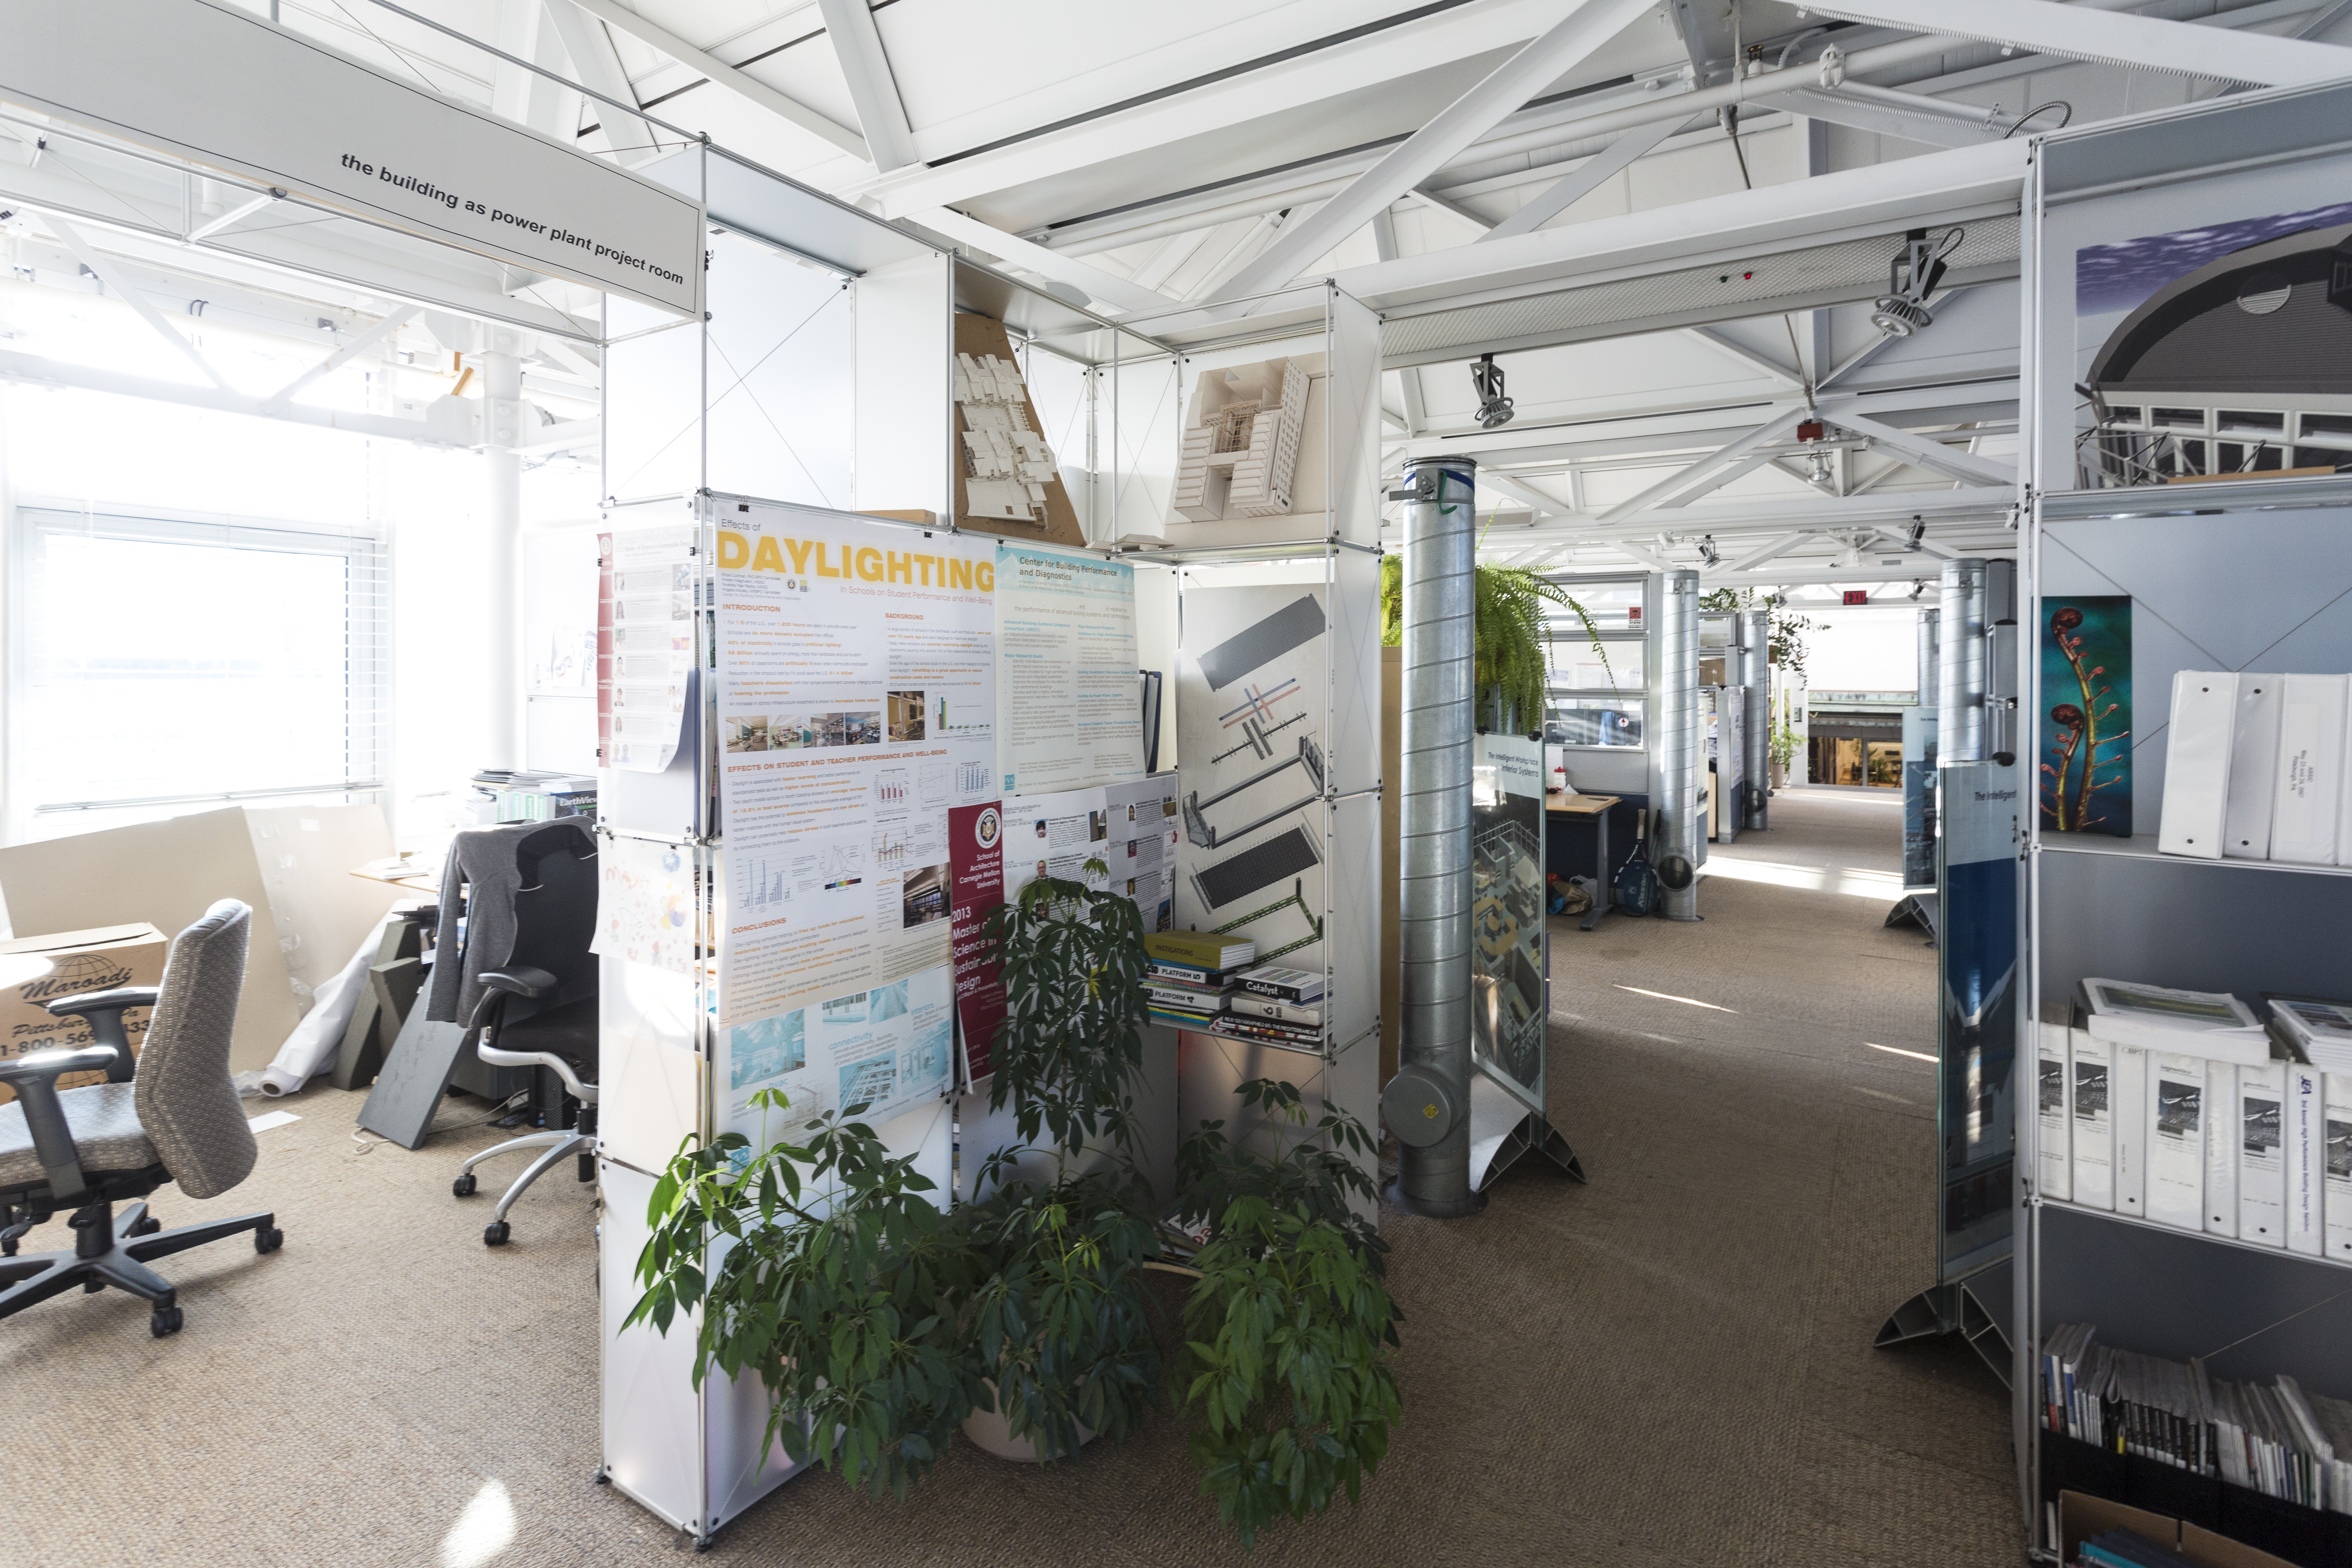
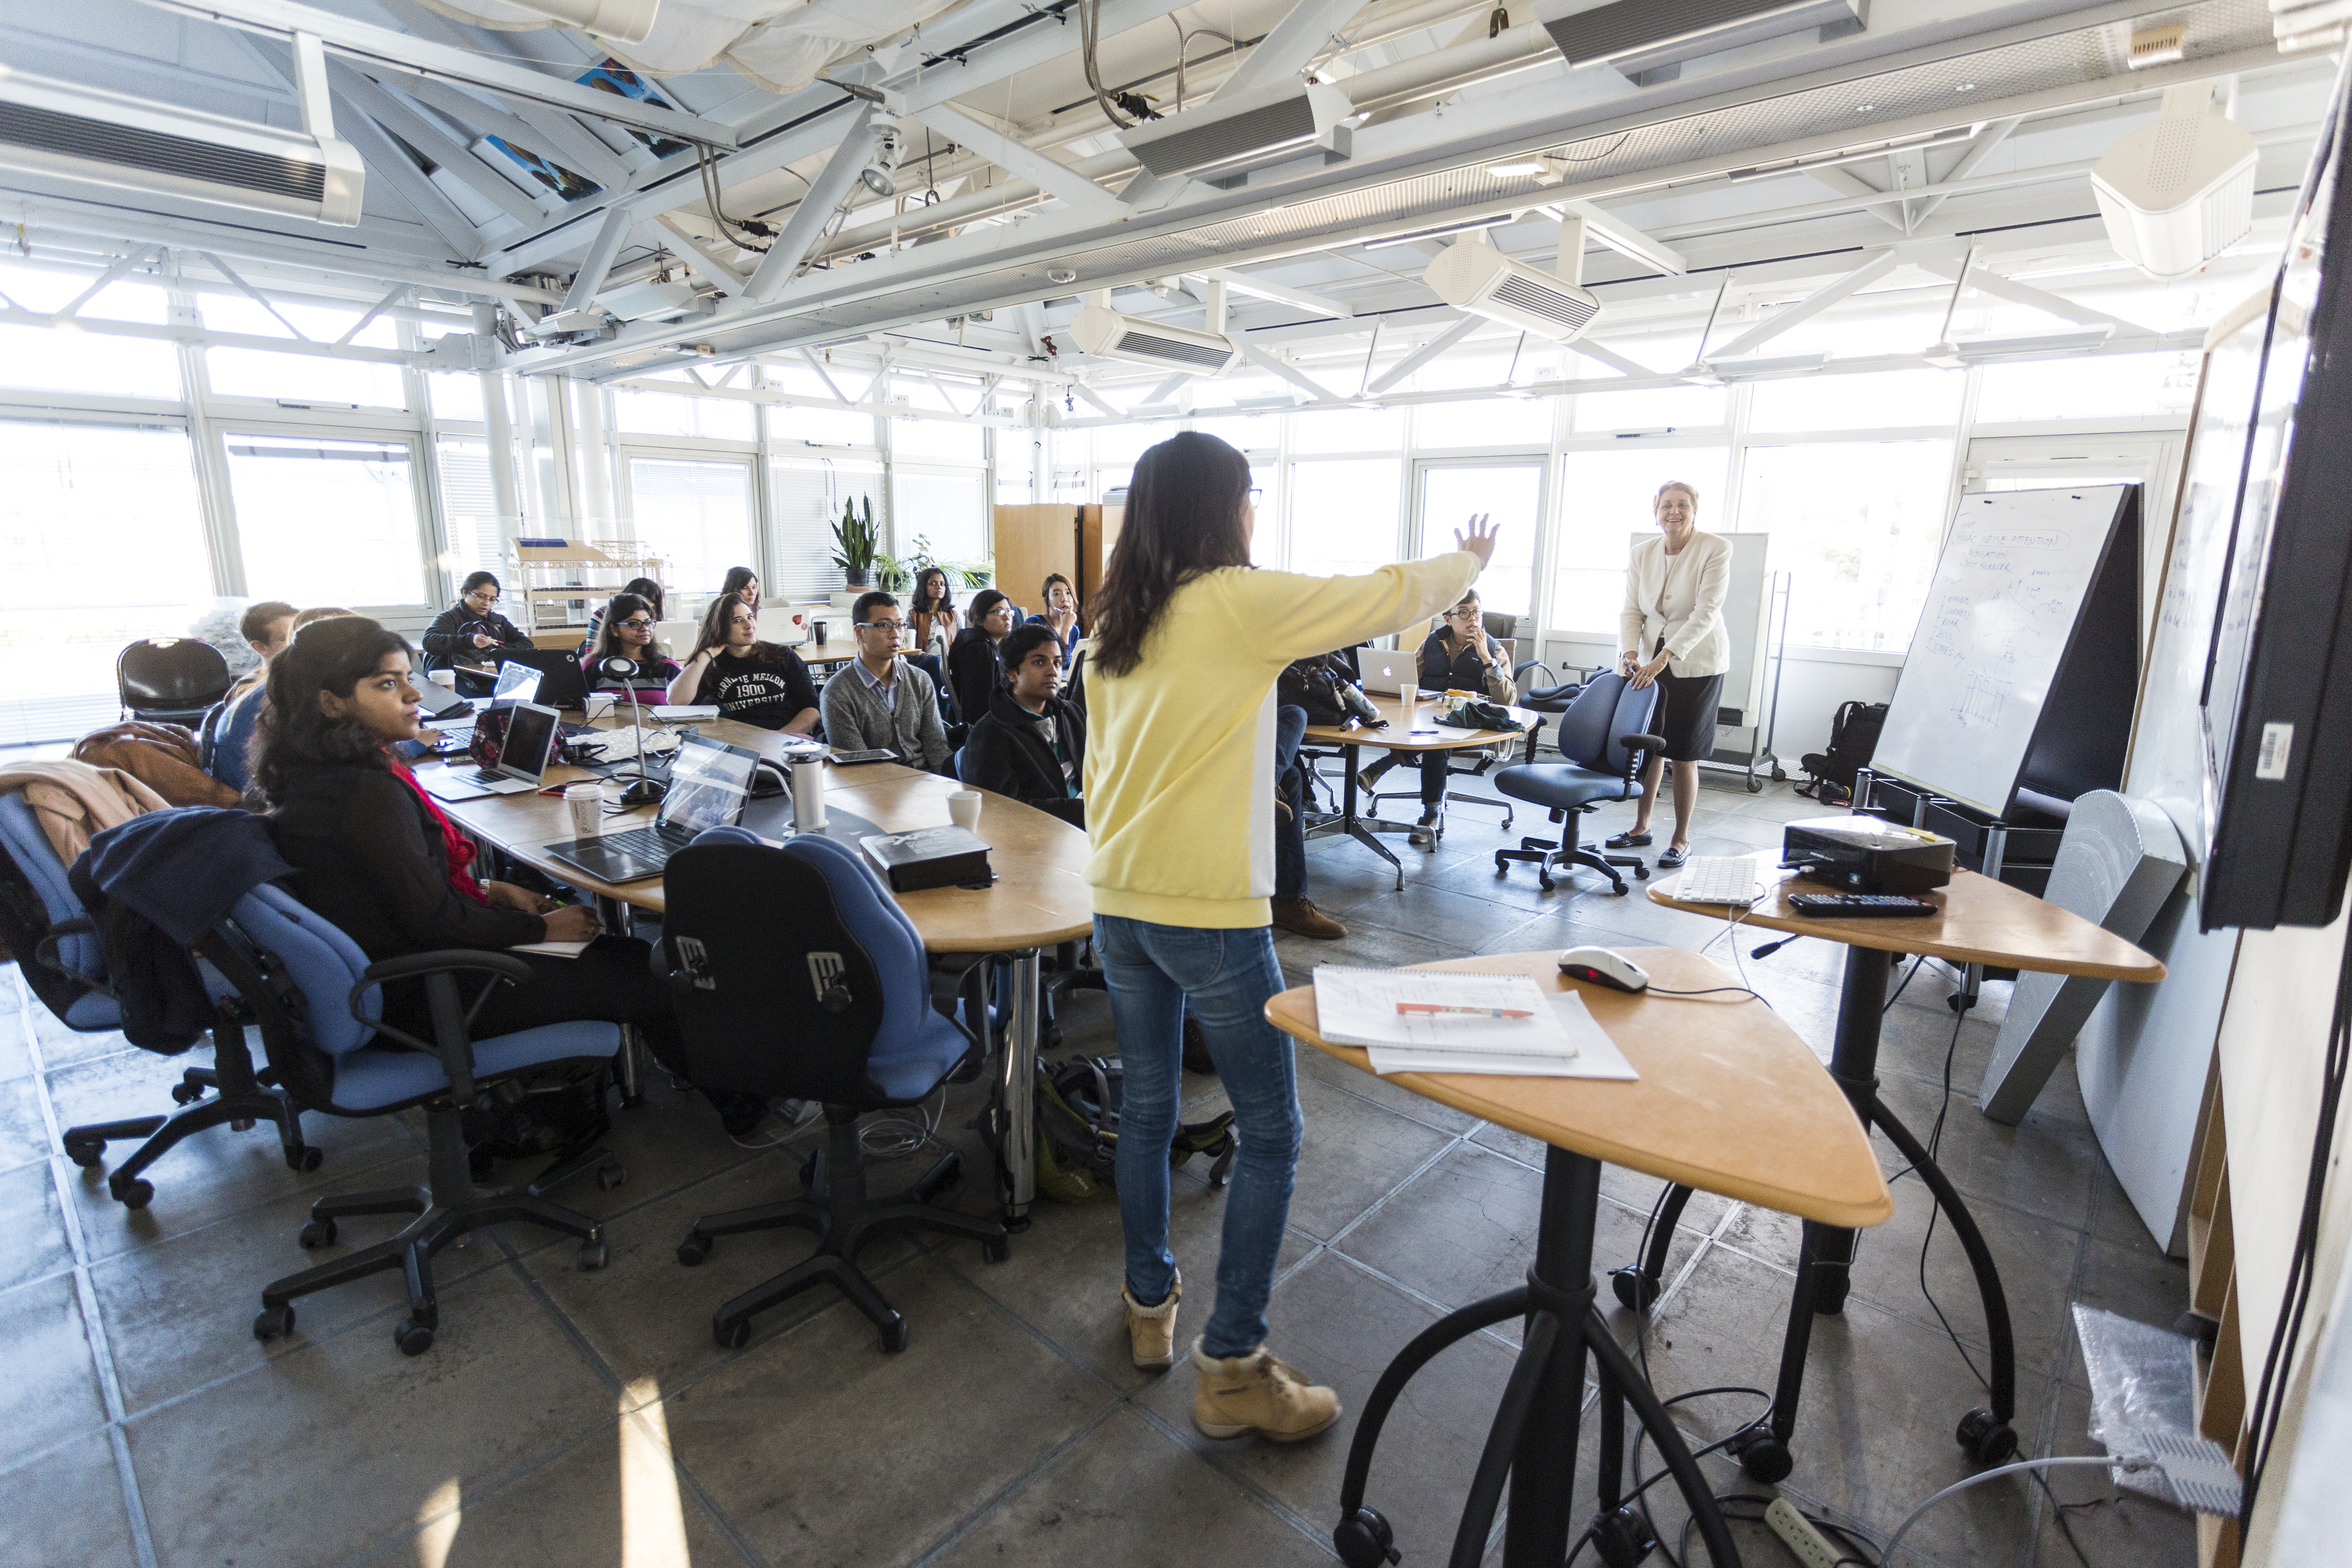
The Robert L. Preger Intelligent Workplace, which sits atop the stunning Margaret Morrison Carnegie Hall, is where Loftness and 30 researchers and graduate students are studying the impact of a variety of factors on the quality of built environments. Natural light dominates this space they call “the Living Laboratory,” streaming in through skylights and wall after wall of expansive windows that offer sweeping views of the campus grounds. Research students occupy open, collaborative workspaces. Unfinished wooden building models sit on work tables which, like the rest of the furniture and walls in the lab, are reconfigurable and movable — all in a matter of minutes. Plants are everywhere, and if you look closely enough, several are wired with sensors, as are the walls and ceilings of this “living” workspace.
For these researchers, the journey started with really simple questions: How do you give people who work in buildings a comfortable environment while using the least possible energy? How do you make people accountable for their own energy footprints? And how can technology assist in that journey?
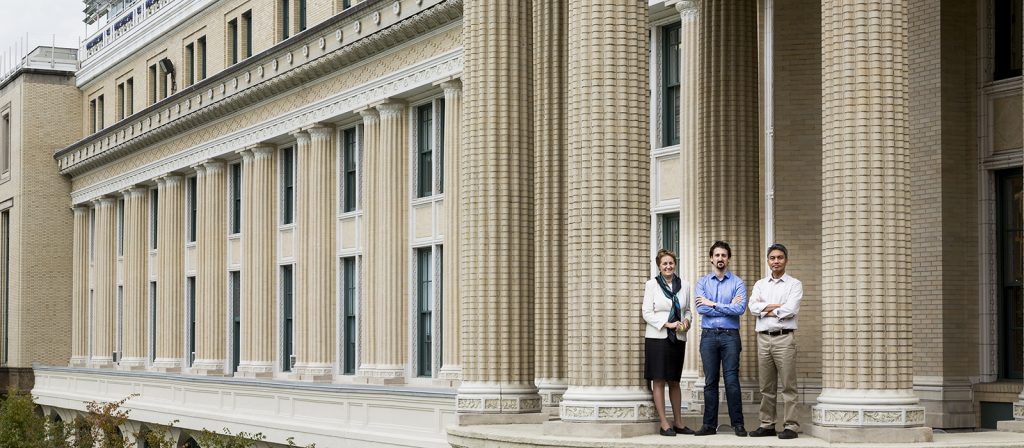
Senior researchers Bertrand Lasternas and Azizan Aziz work with Loftness, sharing her passion for taking on one of the most daunting problems facing our generation — How do you make buildings more energy efficient? The statistics are sobering. Nearly 70 percent of all electricity in the United States goes toward building operations — heating and cooling systems, lighting, ventilation and plug loads. For these researchers, the journey started with really simple questions: How do you give people who work in buildings a comfortable environment while using the least possible energy? How do you make people accountable for their own energy footprints? And how can technology assist in that journey?
Making Sense of Building Data
Not unlike a crew of investigators methodically working their way through evidence at a crime scene, these energy sleuths have cultivated a healthy respect for data and are capturing it from buildings all across the Carnegie Mellon campus. They’re about halfway there, drawing data from 40 buildings, with roughly 25 more to go.
Data is how buildings reveal their secrets and to miss one key piece could potentially derail an entire investigation. “The behaviors of buildings we analyze and the people who occupy them are unique, complex and hard to predict,” says Loftness. There are students who leave windows open in their dorm rooms during bitterly cold winters when heat is blasting. There are building managers who leave air conditioning systems running during cool summer nights. There are offices that enjoy bright daylight but whose staff still leave the lights on all day. And then there is the challenge of managing “things”— thermostats, computers, microwaves, elevators — as well as analyzing external factors such as day-to-day fluctuations in weather.
So Much Inefficiency
The large number of variables means one simple thing: Buildings, like those who inhabit them, are living beings. What are they telling us? More importantly, are we doing enough to listen?
“There is no question that we save 30 percent in most buildings through better awareness of where the energy’s going, and giving users better controls to adjust for their individual needs while driving down energy usage,” Loftness says.
The stakes are high and so is the urgency. About 40 percent of CO2 emissions globally come from buildings.
Buildings use technologies and products assembled in hundreds of unique ways, generating literally millions of variations. Buildings also vary in age, with generations of local architectural adaptations made over time. Then there are the occupants — a mix of people with unique activities and comfort thresholds. Understanding how all these factors mesh together requires historical data and data analysis. A lot of it.
These are complex and critical problems we’re trying to solve. And cloud and machine learning technology is helping us push boundaries of what is possible in ways I couldn’t have imagined a few years ago. — Azizan Aziz, Senior Research Architect
The Data Challenge Meets the Data Sleuths
Making all the captured data from buildings work together is like putting together a massive jigsaw puzzle. Some buildings on campus, such as the Gates Center, have hundreds of sensors, and others not so many. These sensors are tracking CO2 levels in different rooms, measuring the distribution of temperatures by floor, by room and by height, monitoring windows, lighting systems and plug loads. And there’s more: People who work inside make up the most significant part of a building’s heartbeat — so user satisfaction data is being added to the mix based on occupant surveys in order to have a holistic picture of the indoor environmental quality of the workplace.
To say it’s a complex task would be putting it lightly. Lasternas and Aziz spend a good deal of time being data sleuths, and finding ways to listen to what the buildings are trying to communicate — the story that lives in the data.
There is a real difference you can make in energy conservation by giving people data that is actionable instead of asking them to just do their best — Bertrand Lasternas, Senior Researcher
When Lasternas came to Carnegie Mellon from France in 2010, he was a physics and chemistry major working towards a master’s degree in mechanical engineering and building sciences. Today, he’s an expert in extracting data from building management systems and sensors, both to understand how buildings work, as well as to help people manage energy more efficiently.
Recalling challenges from the earlier phases of the research, Lasternas says, “We might have 10 different manufacturers of equipment in a single building, and none of them share information. So how do you pull all of that together? We wanted to empower people to be more engaged in the living building, more aware of their energy usage patterns.”
With help from Microsoft’s Global ISV partner OSIsoft, Lasternas and Aziz began using their solution, the PI System, four years ago. It offered the missing “glue” that helped the team bring data together from various sources, “cleanse” it, store it in a common, usable format, and make it ready for historical and real-time analysis. The PI System supports more than 400 interfaces that can connect to systems from the many different vendors of building systems and controls.
The Machine Learning Breakthrough
Having conquered the data integration and storage challenge, the team dove into analysis — a world of massive spreadsheets and programming languages such as MATLAB to handle big, iterative computations. It was an exercise that very quickly got unwieldy. “We’re not trained data scientists by background, and complex statistical packages are outside of our immediate area of expertise,” says Aziz.
“One of our former students was using MATLAB for analysis,” he recalls. “It took her a long time just to prepare and sort the data, and then a single run of analysis took 30-45 minutes. That’s far too long to develop good predictions for demand reduction. We really need to do these iterative analyses in real-time.”
Machine Learning, cloud and data visualization technologies changed the dynamics of their project dramatically. “With Azure Machine Learning, the time it took to run a single experiment went from 45 minutes to instantaneous,” Aziz says. “It’s really fun to be able to use multiple types of machine learning algorithms and just have the results appear immediately. We’re able to play with all the variables and make sense of which ones contribute most to a specific change in building conditions.”
Letting the Data Tell the Story
To let the data tell its own story in a way that is visual and easy to grasp, the Carnegie Mellon researchers build “digital dashboards” that make data anomalies much easier to spot. Using these dashboards, they’ve been able to solve puzzles in the buildings they’re working on. In one case, Lasternas recalls, “We saw an unusual area of low temperature in a building and realized that someone was leaving a window open in the middle of winter, when it was minus-eight degrees outside.”
According to Aziz, when a strange condition is spotted on the dashboard, the solution is often a simple one. “We ask people why they have the boiler on when the temperature outside is 85 degrees. Turns out they didn’t know it was on, because they don’t have the data presented to them clearly,” he says.
Having data-based insight on-the-fly is great, but where things get really interesting is with the potential to do predictive modeling. This is an area where cloud and machine learning technologies have truly been a game changer. Because Carnegie Mellon is collecting and storing real-time and historical data on campus buildings using the PI System, they finally have the ability to do predictive analysis using Azure Machine Learning in exciting ways.

One of the team’s early experiments involved trying to figure out the ideal time to ramp up the heating in campus buildings to hit 72 degrees at start of business (by 8 a.m.), given predicted variations in outdoor temperature and sunshine. Using Azure Machine Learning, they built a model that looked at months of “heat up” data from the building’s records and matched that to multi-day external temperatures and anticipated solar radiation. The result? They were able to zero in on a custom model for each day to start heating a building at the lowest energy use.
“As simple as that victory sounds, the implications for energy and dollar savings are simply enormous —especially when you scale up,” notes Lasternas. For this group of researchers, the potential to scale up such predictive capabilities — to forecast factors such as energy demand spikes and equipment failures, to simply and proactively give people actionable information at their fingertips — is where their research can have real and broad impact.
“These are complex and critical problems we’re trying to solve. And cloud and machine learning technology is helping us push boundaries of what is possible in ways I couldn’t have imagined a few years ago,” Aziz says.
An Energy Crossroads
The journey of these energy crusaders is just picking up steam. Early alliances include partnerships and projects with United States Department of Energy and the Department of Defense, OSIsoft, the city of Pittsburgh and PNC Bank, one of the largest diversified financial services organizations in the country.
With the growing commitment to sustainable design initiatives across the public and private sector, Loftness believes the energy conservation movement is quickly hitting a tipping point in the U.S.
“Climate change is a serious challenge and I expect to see energy management in buildings rise from its under-championed status today to the forefront of the energy conservation movement,” Loftness says. “Technology is helping us get to better insights, and faster, creating a movement that will ripple across the country in the next few years, reshaping how we live, work and play.”