4 ways sharing data is improving our world
In 1854, London was the world’s biggest city, with a population of around 2.5 million people. It was a global hub of commerce and industry. It was also riddled with disease. That year, the district of Soho, which would eventually become the heart of 20th century London’s Swinging Sixties scene, was being ravaged by cholera.
The search for the cause of the epidemic is one illustration of how joining together data from disparate sources can yield results.

1. On the cholera trail
It was thanks to the work of a doctor named John Snow that the link between cholera and contaminated drinking water was established. It’s something he couldn’t have done without what, today, we would call open data.
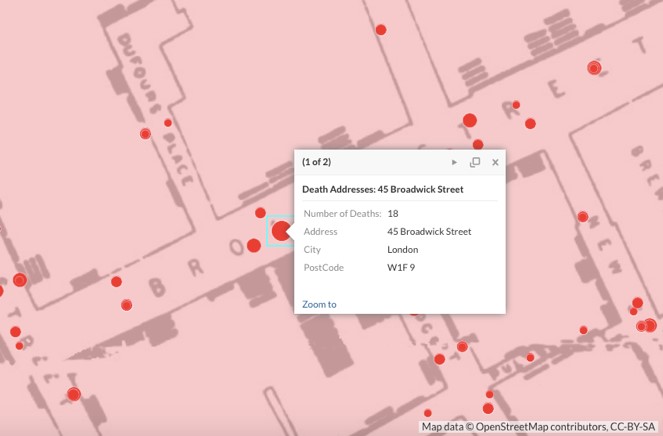
Snow created a map pinpointing the residences of people who contracted and died from cholera. He overlaid it with details of the locations of public water pumps, situated on streets around the area. It became clear that the highest concentration of deaths was in the vicinity of one particular pump, on Broad Street.
The pump is no longer there, of course, and Broad Street is now called Broadwick Street, but there is a commemorative replica close to the original site. There is even a pub named The John Snow near where the pump sat.
By sharing his findings and data map, Snow was able to persuade the City of Westminster council to close the pump. Without access to death statistics and detailed maps of the area showing the pump locations, this would have been a far more challenging undertaking.
[Read more: How clean water data is helping to protect Brazil’s precious ecosystems]
2. Illegal fishing watch
Satellite image data is also helping in the fight against illegal fishing. There could be as many as 4.6 million fishing vessels in the world, providing fish for a global seafood market valued at over $120 billion.
Fish is a life-sustaining source of protein for billions of people. But, according to the U.N., one-third of all fish stocks are now overfished and are no longer sustainable.
Step forward OceanMind, which has pulled in data from different sources to crack down on illegal fishing. Using collision-avoidance transponders aboard boats, radar images, satellite imagery and cellphone signals, its system can track many thousands of boats.
OceanMind’s machine-learning algorithms are able to predict the type of fishing behavior that ought to be taking place based on a vessel’s location. If something doesn’t seem right, it can flag it. The authorities can then be contacted to verify whether a particular vessel has the appropriate permissions or if it should be intercepted.
[Read more: ‘We are at a crossroads’ – How Microsoft’s Accessibility team is making an impact that will be felt for generations]
3. Natural disasters and innovative solutions
The Humanitarian OpenStreetMap Team (HOT) creates maps with rich layers of open data showing details that could help save lives. Team members download satellite images of a specific area and mark up anything that looks like it might be a building, a road, a settlement and so on.
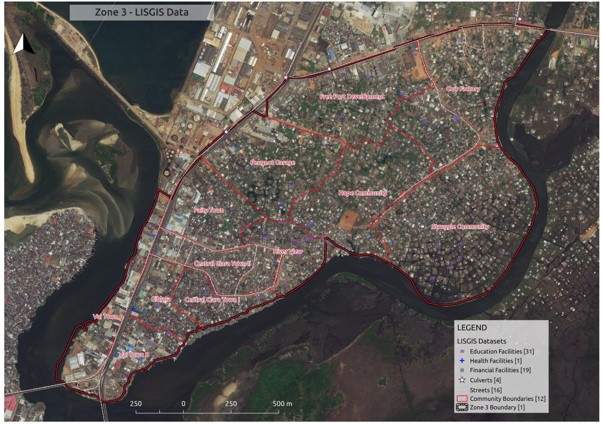
The importance of having detailed maps was demonstrated in April 2015, when one of the worst earthquakes of the modern era struck the mountainous country of Nepal. Around 600,000 homes were destroyed and as many as 9,000 people lost their lives. Without maps showing where people might be found, aid agencies didn’t know where to direct their efforts.
Within just a few hours, HOT had volunteers and partner agencies from all over the world working together to build detailed maps of the affected area. More than 4,000 mappers helped identify roads, residential neighborhoods and camps of displaced people – they even found safe spaces for helicopters to land.
[Read more: 5 ways technology is changing how people with disabilities experience the world]
4. Cancer research across borders
Along the Pacific Northwest of the U.S. and Canada, a number of leading clinical institutions are working together, sharing data to push the boundaries of cancer research further than ever.
The Cascadia Data Discovery Initiative (CDDI) has established a framework for cross-institutional data governance. It is also building an ecosystem of shared workspaces, analytical tools and methods among five key organizations in the CDDI.
If one institution shares the work it is doing on a particular type of cancer, another institution with a mutual scientific interest can add its insights, too. It’s a bold and exciting vision that, nevertheless, faces several significant challenges. There’s a legacy of regulatory, social, technical and licensing barriers that prohibits and complicates cross-organizational access to data and resources. Then there’s international borders to consider.
Collating and sharing datasets large enough to support machine learning can easily be held up due to these complexities. However, CDDI aims to establish the Cascadia region as the global leader in biomedical data science and health technology innovation, with a robust health-data ecosystem that focuses on enabling collaboration, data sharing and data-driven research.
For more on open data, visit Microsoft’s Open Data Campaign website. And follow @MSFTIssues on Twitter.