Tracking the effects of glacial melting at the top of the world
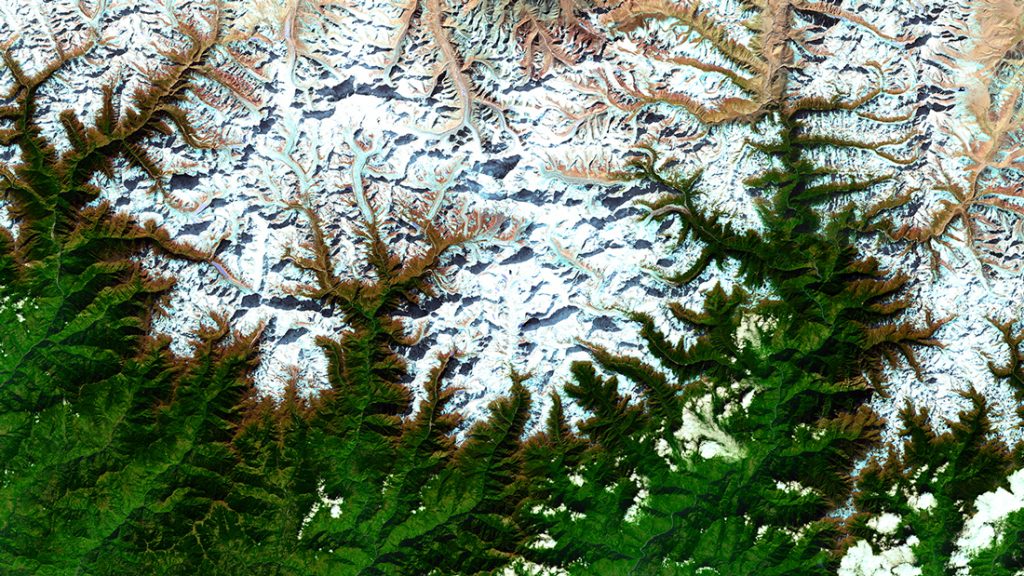
The Hindu Kush Himalayan region, stretching for more than 2,000 miles, is home to the world’s highest mountains. Names like Everest, K2 and Kanchenjunga summon images of snow-capped, icy peaks as far as the eye can see.
The mountain range is also home to the world’s third-largest concentration of snow and ice, earning it the moniker the third pole; only the North and South Poles contain more. The glaciers of the Hindu Kush Himalayas are the main source of fresh water for around two billion people living in the region. That water is vital to the area’s agriculture, too, as it helps irrigate land that produces food for billions more in Afghanistan, Pakistan, India, China, Myanmar, Bhutan, Nepal and Bangladesh.
However, by the end of this century, two-thirds of that snow and ice could be lost because of climate change. A network of data scientists and environmentalists around the world, and on the ground in the Hindu Kush Himalayas, are working to understand the extent of glacial shrinkage and its potential consequences. Among the predictions are floods and droughts that could force mass migration from the immediate area and cause widespread damage far downstream, too.
Collaborating with open data
Microsoft’s AI for Good Research Lab is working with the International Centre for Integrated Mountain Development (ICIMOD), the University of Wisconsin, and the Quebec AI Institute (Mila). Mila was founded in 1993 by professor Yoshua Bengio, a Canadian computer scientist renowned for his work on artificial intelligence (AI) and neural networks. Professor Bengio was the principal investigator on the project.
Together, the groups are working to understand the extent of glacial melting in the Hindu Kush Himalayan region, its effects and what can be done to minimize its impact.
To do this, the team needs data. And lots of it. More importantly, that data needs to be shared and used by many researchers and institutions – it needs to be open. To facilitate data collection and sharing, the team is drawing in open data from a variety of sources so that it can be worked on collaboratively.
The team works with openly available mapping and satellite data that is processed by a machine learning algorithm. That algorithm has been trained to scan for glacier boundaries and other points on the map to supply rapid results. Now, something that used to require months of manual processing is possible within days.
The final datasets produced by the team are also made available as open data that can be freely used by other teams of researchers and analysts who are using AI, machine learning and data analysis for the greater good.
The shared open data from the project breaks down the map of the area by “tiles.” Each tile is equivalent to an area measuring around 6 km x 7.5 km (approximately 3.7 miles x 4.6 miles). To date there are 35 tiles from Afghanistan, Bangladesh, Bhutan, China, India, Myanmar, Nepal and Pakistan in the glacier-mapping dataset, including images of the Hindu Kush Himalayas and markers detailing the locations of glaciers.
Kris Sankaran is an assistant professor of statistics at the University of Wisconsin-Madison, a former postdoctoral researcher at Mila and a member of the team mapping the glaciers. He believes having the right data is absolutely essential to the success of the project and others like it.
“Machine learning on its own doesn’t really solve anything in a vacuum. One of the biggest challenges in this sort of work is having access to relevant data. It doesn’t matter how fancy your algorithms are if what you’re working with isn’t really that meaningful,” he says.
[READ MORE: 4 ways sharing data is improving our world]
Analyzing change at glacial speed
Major rivers like the Ganges, the Indus and the Yangtze stem from the Himalayas and are fed by meltwater. Tracking the retreat of the region’s glaciers will help shed light on how extensive the melting is likely to be and will enable mathematical modeling of water flow.
If we can see how fast they are melting we can understand what is likely to happen to those glaciers in 50 years or 100 years.
– Mir Abdul Matin, ICIMOD
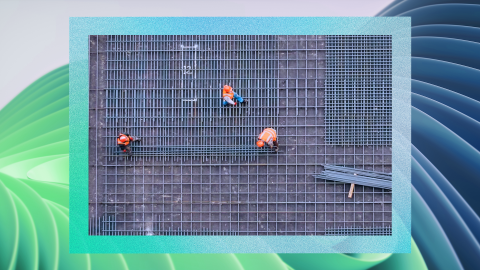
In the past, that was a slow-moving, time-consuming activity, as Microsoft data scientist Anthony Ortiz explains: “You really need to understand how the glaciers are changing, but it is a mostly manual process. It relies on analyzing multiple layers of satellite imagery, delineating all those layers one by one, to conduct an analysis of how things are changing.”
Arriving at just a single definitive data point using this process can take months, Ortiz says. The situation is further complicated by the age of available map data. “You might find you have one map from 2010 and maybe another one from 2000,” he explains. “Let’s say you want to determine what’s been happening in 2020. So you get the relevant satellite data, and then it takes two months to process it. By the time you get to see what’s happened, the situation has already changed.”
Automating the process of tracing the end points of glaciers – their boundaries – is the only way the team can produce up-to-date, reliable information.
[READ MORE: Here’s how AI is helping secure water for your future]
Understanding glacial composition
However, the scope of the results goes further than that. Glaciers are made up of compacted snow and ice. They also contain significant amounts of rocks, soil and minerals, giving each glacier a distinct composition that is determined by the land it sits on and has carved its way through.
The mapping of glacier melt is similar to the work being undertaken by Dr. Joseph Cook, a Microsoft AI for Earth grantee, on the Greenland Ice Sheet. Dr. Cook’s work determined that algae was flourishing in the nutrient-rich meltwater. As those well-fed algal blooms grew, the dark patches they created on the ice caused the surface of the glacier to warm faster, releasing more nutrients that fed the algae, which continued to grow apace.
Cook’s research is related to another aspect of the AI for Good Research Lab’s work – assessing whether some glaciers are more susceptible to global temperature rises than others. The team is looking into the composition of glaciers to see whether clean ice is more or less susceptible to warming than ice that is covered by debris.
[READ MORE: Open data: Your questions answered]
Counting the human cost of climate change
A flood in 2018 was a clear demonstration of why understanding glacial change in the Hindu Kush Himalayan area is so important. Rapid and often undetected melting can bring about the formation of glacial lakes. If water levels continue to rise, it can lead to what’s known as a glacial lake outburst flood. In the Panjshir Valley in north-central Afghanistan, one such event destroyed homes and businesses in two villages, leaving hundreds of people homeless and claiming 10 lives.
Mir Abdul Matin works in the Geospatial Solutions team at ICIMOD, which has partnered with Microsoft in the research into glacial change. “If we can see how fast they are melting, we can understand what is likely to happen to those glaciers in 50 years or 100 years. That can act as a sign of the possible impact climate change will have in the region,” he says.
His colleague Tenzing Chogyal Sherpa comes from the area around Everest and knows firsthand how important the glaciers are. “They’re like a water storage tank,” he says. “But the amount of water present is depleting, so maybe in 10 years we might need to find another source of water.”
You can find information on Microsoft’s Open Data Campaign here. And follow @MSFTIssues on Twitter.